San Francisco Market Heats Up
The City’s housing market is mirroring the weather — heating up fast. Stable mortgage rates, tight inventory, and renewed buyer confidence have reignited competition, leading to multiple offers and the fastest sales pace we’ve seen in nearly three years. Adding to the momentum, San Francisco’s AI-driven economic boom continues to draw new talent, investment, and wealth into the region, fueling fresh demand for housing at nearly every price point.
National Momentum and Local Impact
Nationally, the Federal Reserve kicked off what appears to be the start of a rate-cutting cycle with a quarter-point reduction to the federal funds rate. Even more encouraging, Chairman Jerome Powell signaled two additional cuts before year-end — a move that could further energize housing demand. While many markets across the country have seen activity stall, San Francisco is responding early, with both sales and prices showing renewed strength.
Current Mortgage Rates
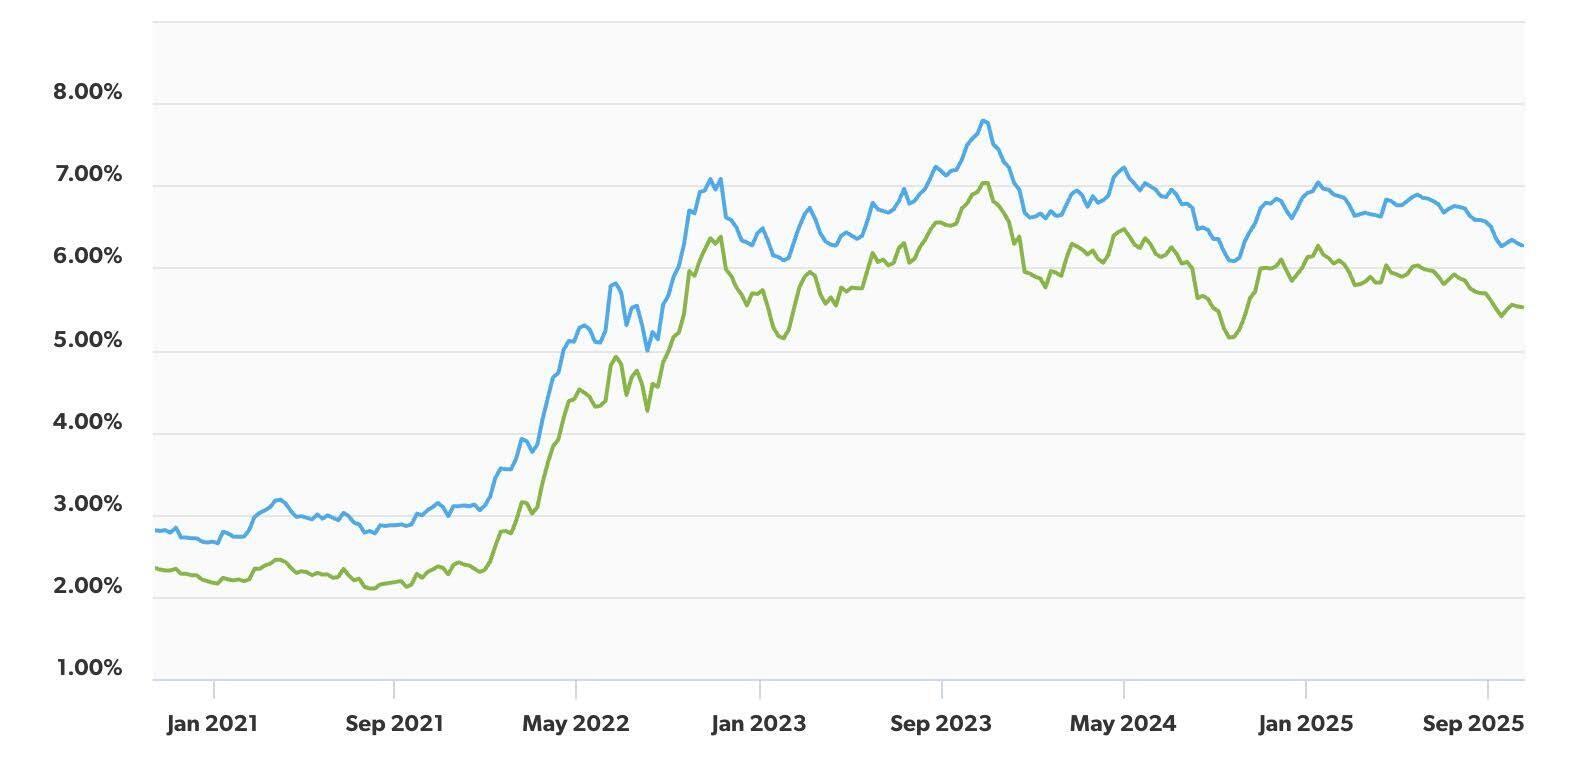
The 30-year fixed-rate mortgage sits at 6.27% for the week ending October 17, 2025, while the 15-year fixed-rate mortgage is at 5.52%, numbers slightly below where they were last year at this time (6.44% and 5.63%, respectively). However, they’re still a far cry from the rates seen in October 2020 (2.81% and 2.35%, respectively). (Freddie Mac)
Historical Mortgage Rates
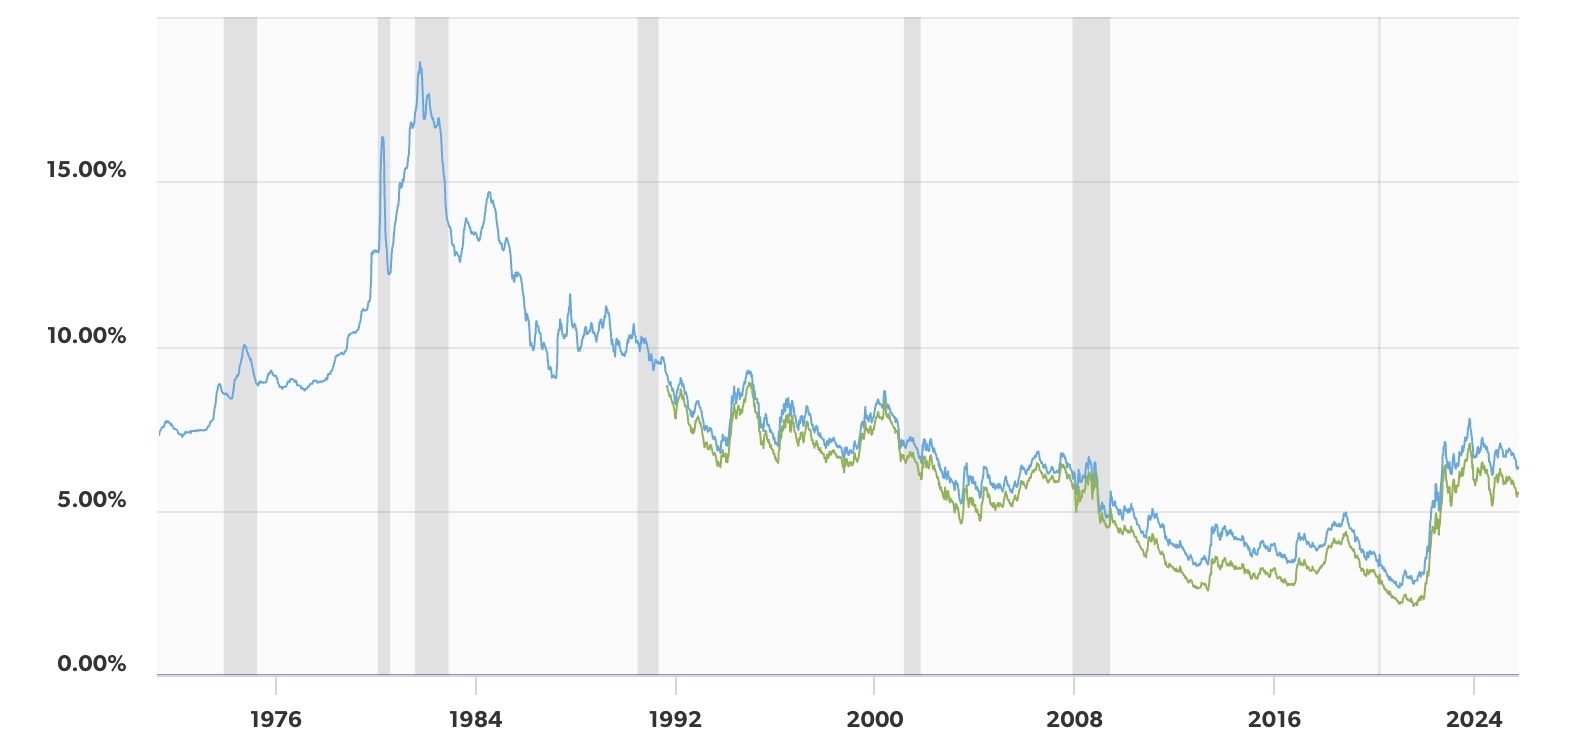
For some context for today’s market, the below chart looks at mortgage rates from the past 50+ years, from 1971 through October 17. Remember when your parents told you they paid double-digit interest rates? They did. The high point was 18.39%, exactly 44 years ago this month. (Freddie Mac)
Mortgage Rate Predictions
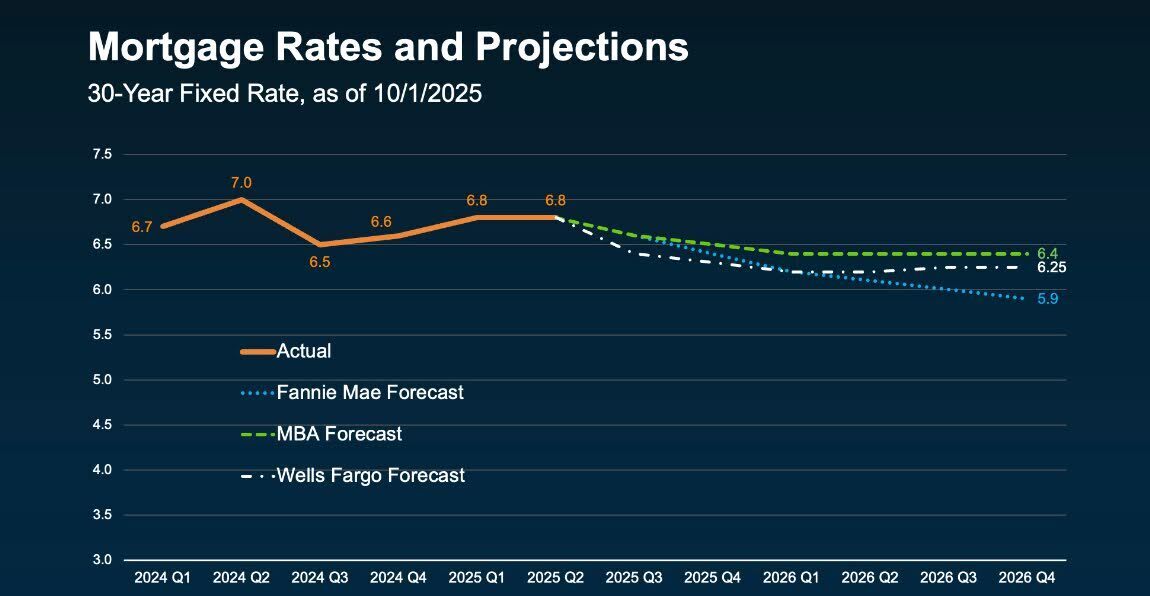
How low will mortgage rates go? Experts predict gradual improvement over the next year - not a sharp drop, but steady easing with some bumps along the way as new economic data rolls in. Even small declines can make a meaningful difference for buyers and homeowners alike. (Keeping Current Matters, Fannie Mae, Mortgage Bankers Association, Wells Fargo)
National Home Price Expectations
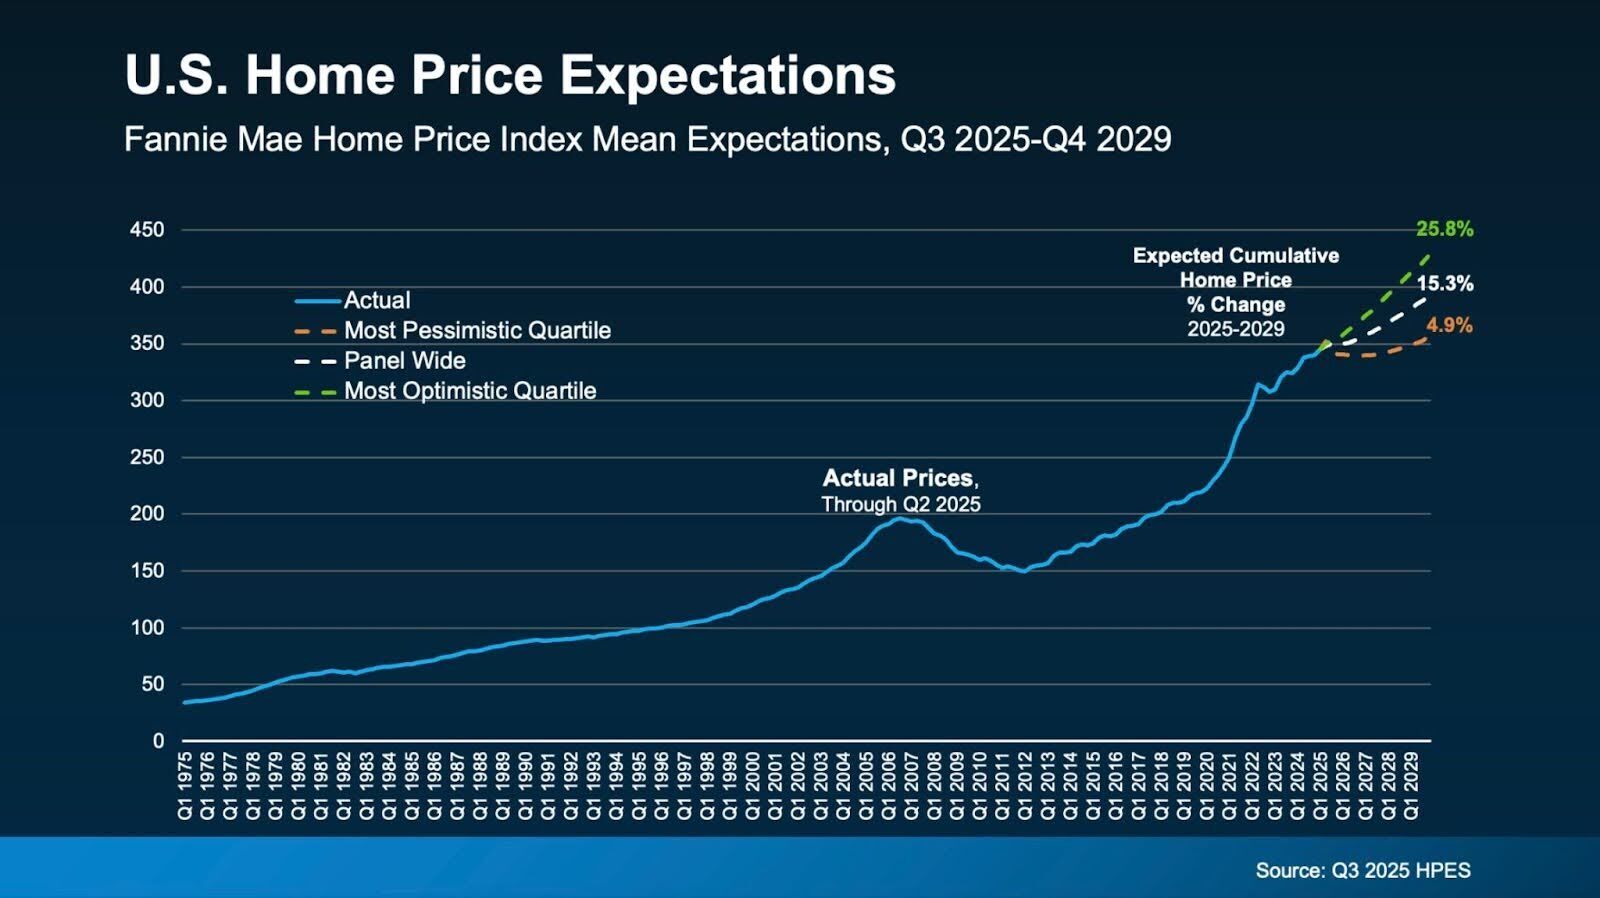
Fannie Mae projects steady home price growth ahead. U.S. home values are expected to rise 15.3% cumulatively from 2025–2029, with optimistic forecasts reaching nearly 26% and even the most cautious projections still showing gains. (Fannie Mae, Keeping Current Matters)
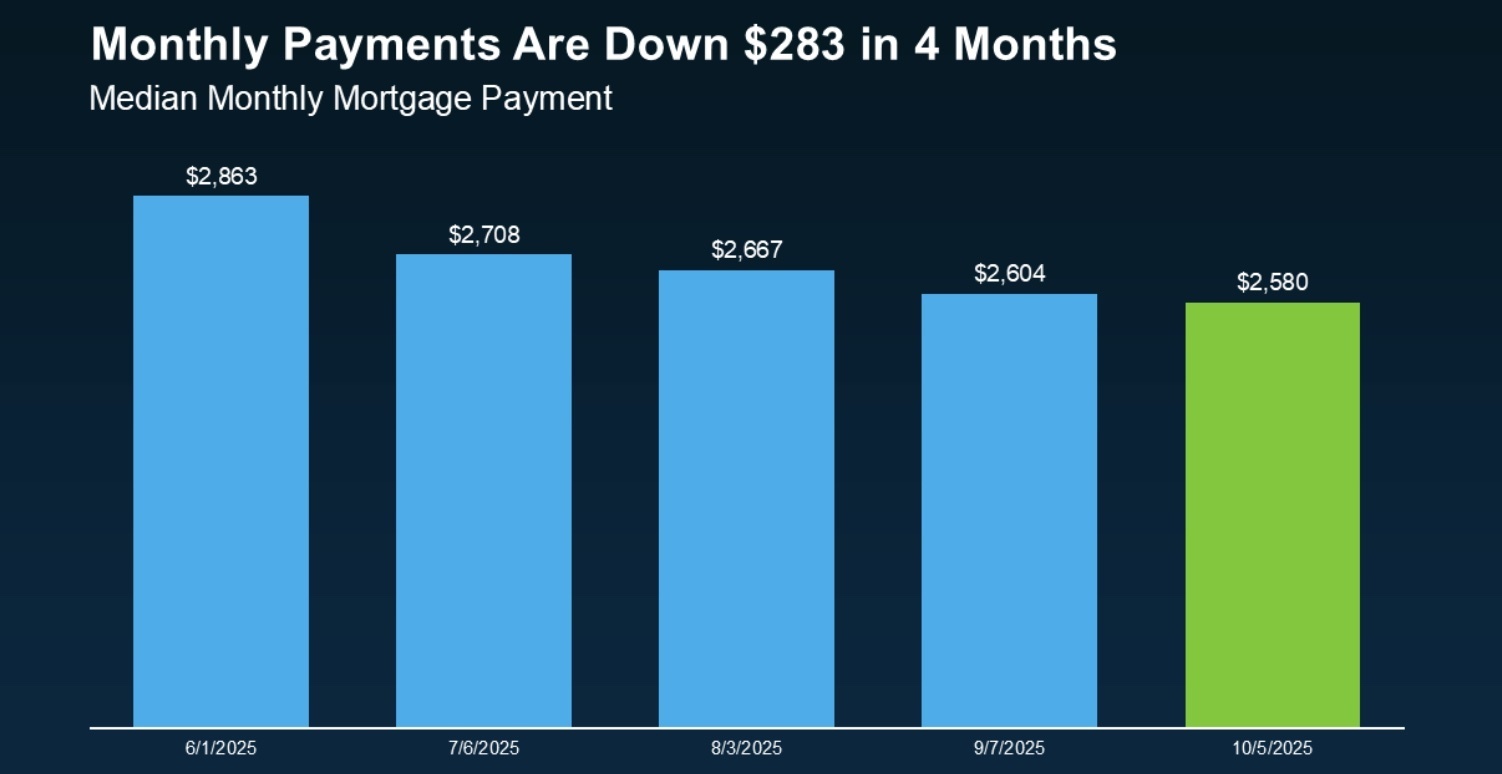
Mortgage Payment Trends
Mortgage payments are now averaging $280 less per month than just a few months ago - marking the best home affordability in 2.5 years. For many buyers, that shift can make the difference between waiting and finally buying. (Keeping Current Matters, Redfin)
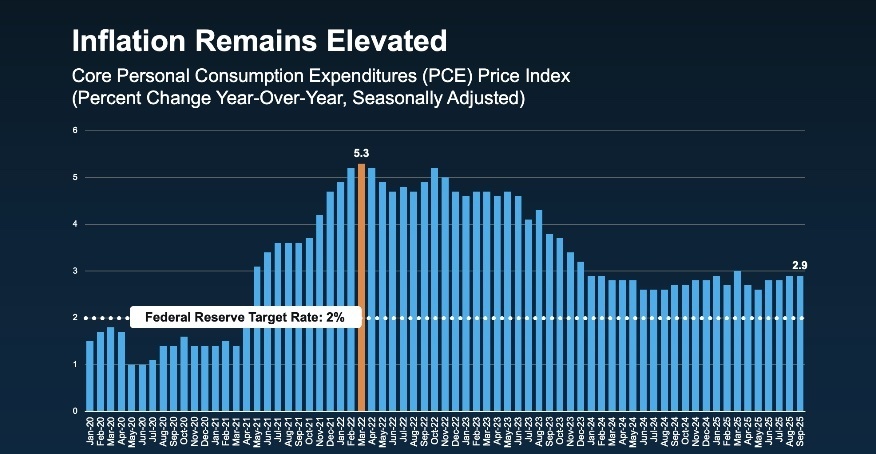
Inflation Remains Elevated
Core inflation remains above the Federal Reserve’s 2% target, coming in at 2.9% in September. While well below its 2022 peak of 5.3%, persistent price pressures continue to challenge policymakers and shape expectations for future rate cuts. (Keeping Current Matters)
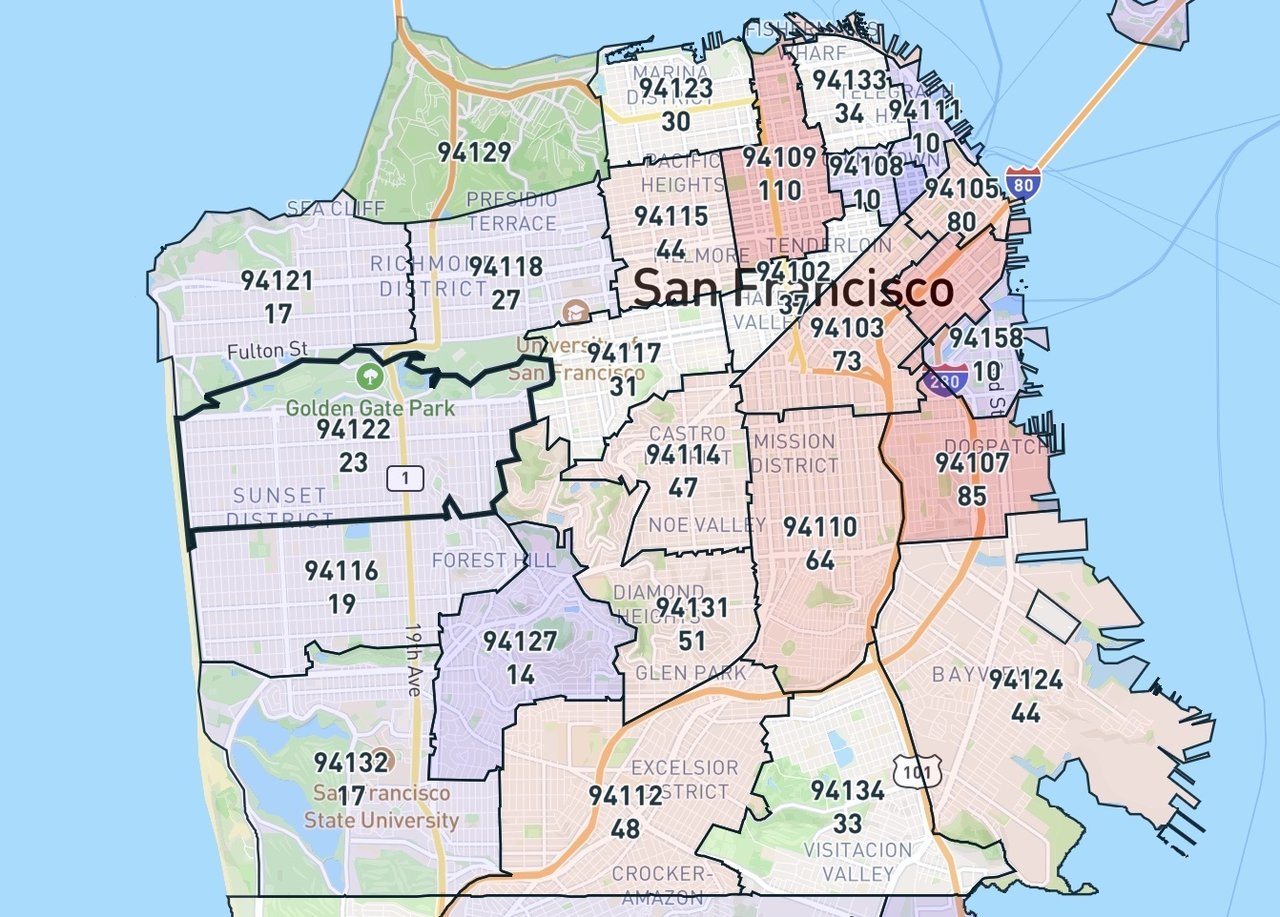
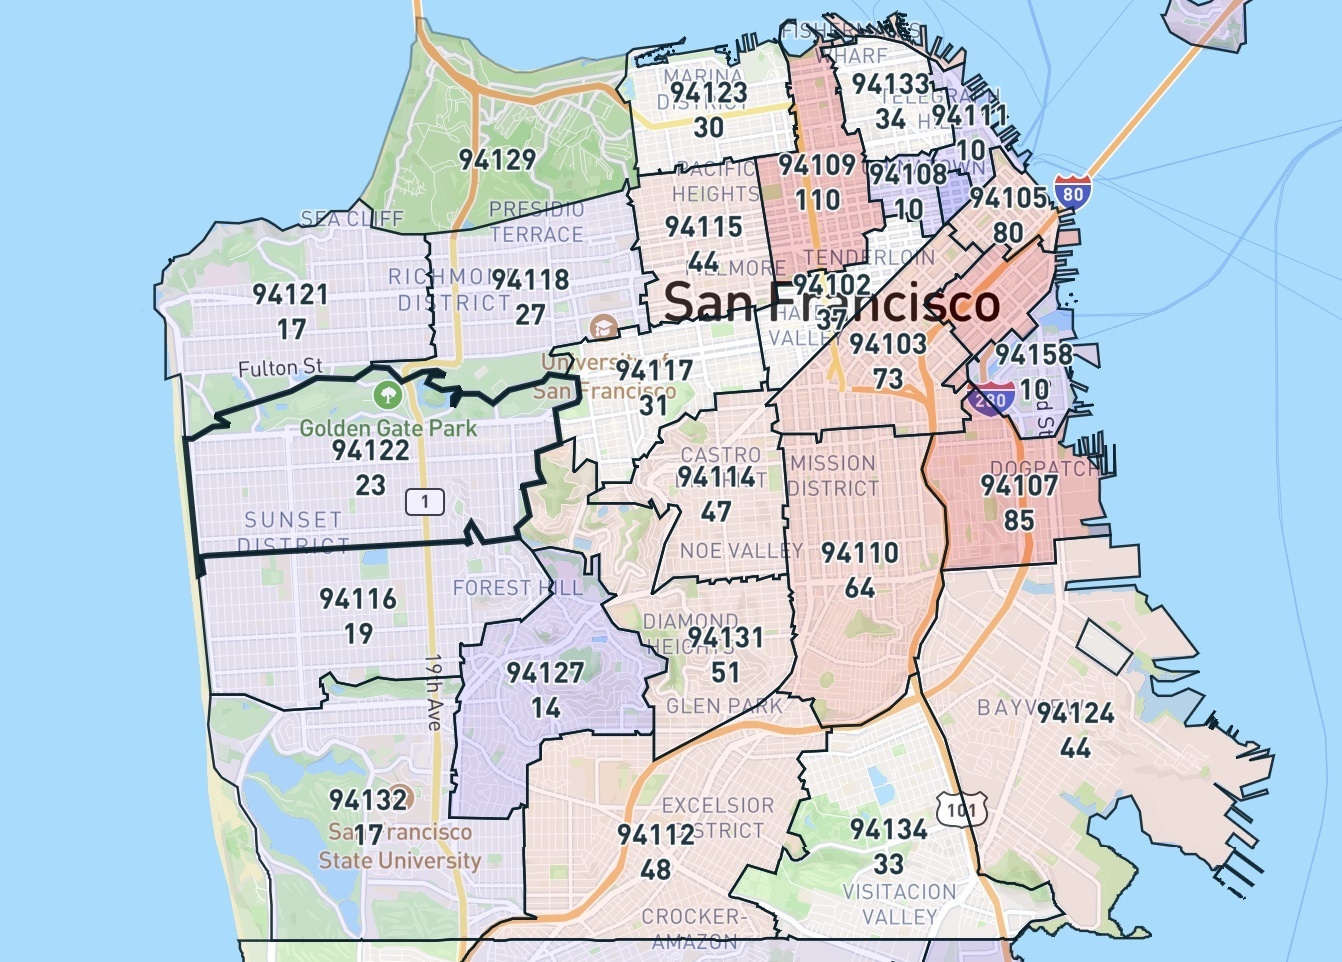
Active Listings in San Francisco
The chart below shows the number of active residential listings in San Francisco by zip code. This does not include those listings that are pending. (Reventure)
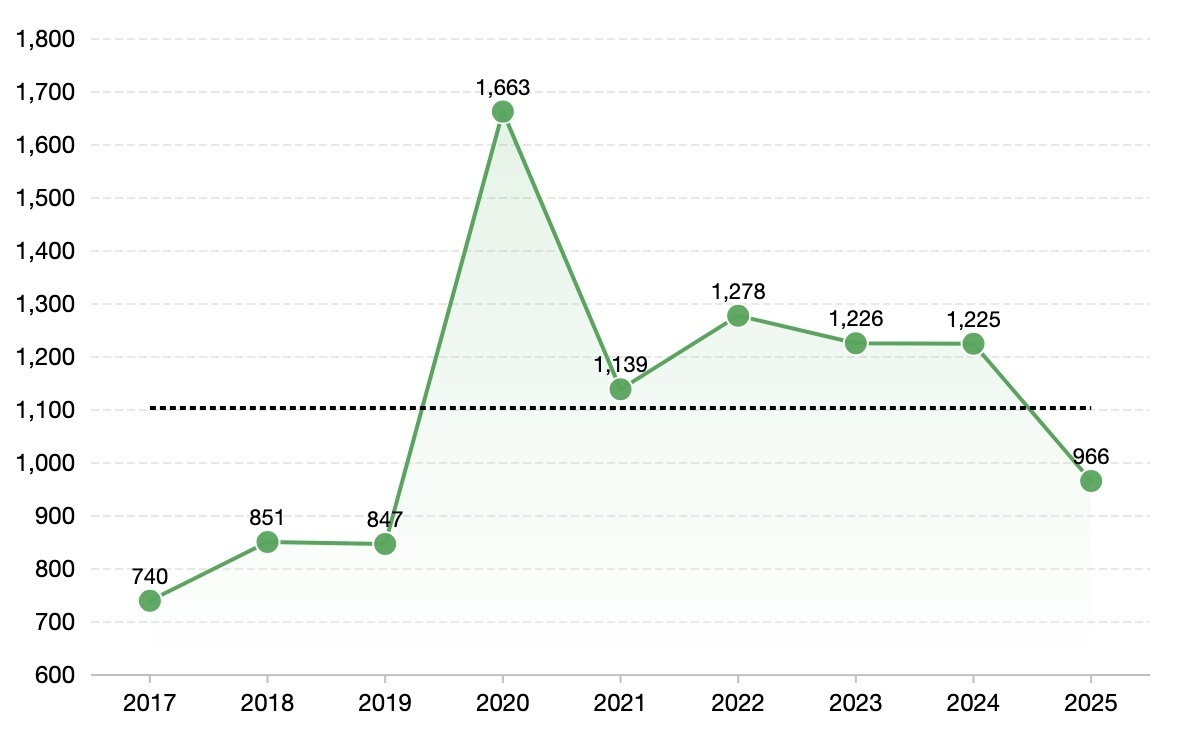
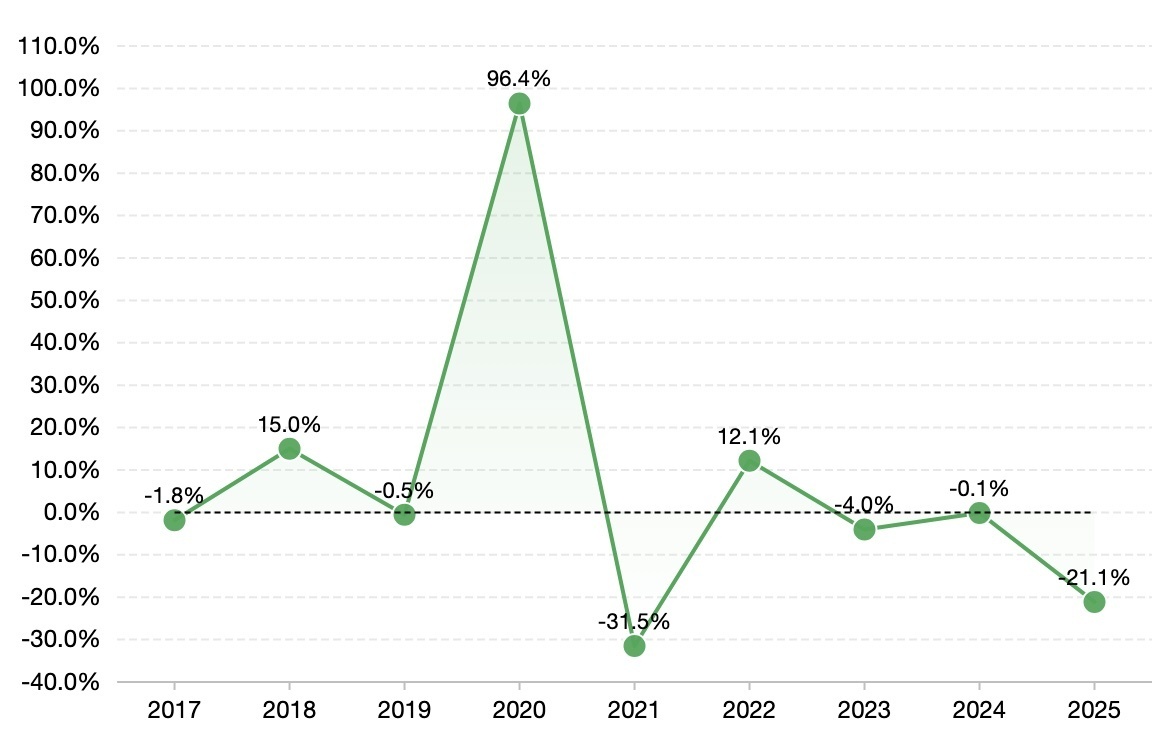
Active Listings in San Francisco
The first chart shows the for sale inventory from September 2017 through September 2025, while the second chart reflects the growth rate for those active listings. After years of wide fluctuations, San Francisco’s for-sale inventory remains tight. Active listings fell another 21% in 2025 — the latest dip in a market still adjusting to post-pandemic realities and rate-sensitive sellers. (Reventure)
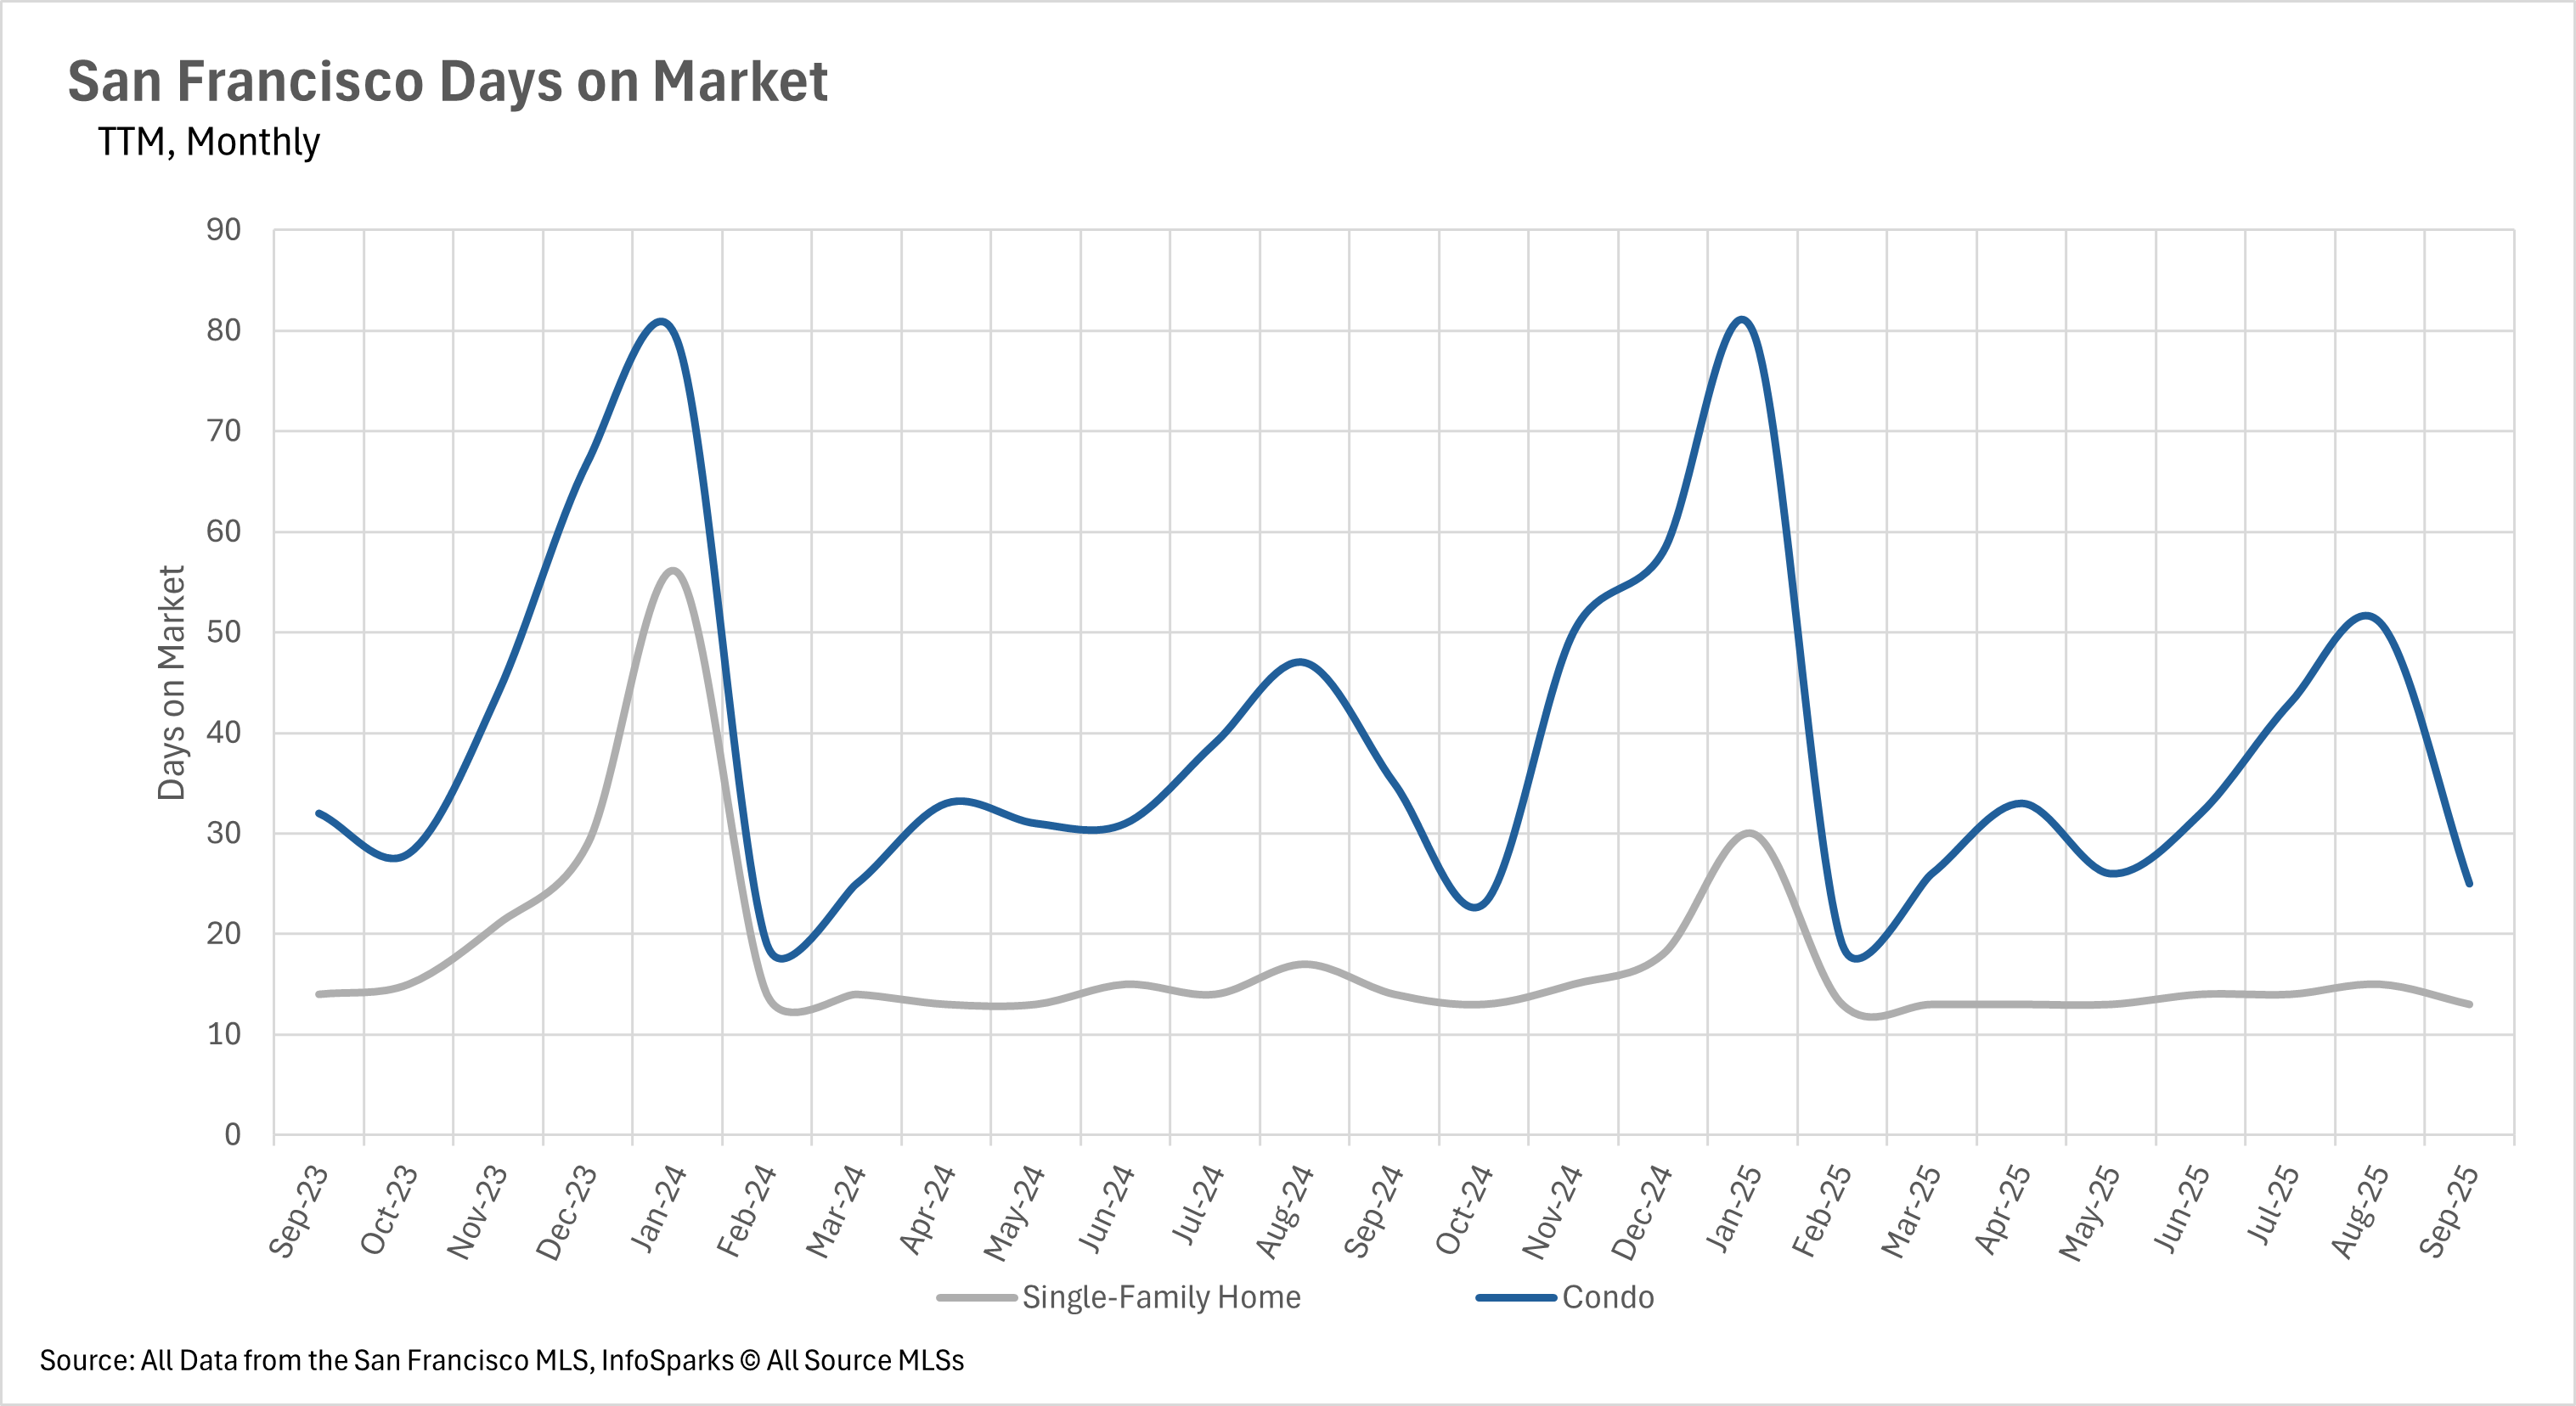
San Francisco Days on Market
As you might expect, when inventories shrink, the market becomes much more competitive, which is certainly the dynamic that we are watching play out in San Francisco. The average single-family home is spending just 13 days on the market, representing a 7.14% year-over-year decrease. By the same token, the average condo listing is spending just 25 days on the market, representing a 28.57% year-over-year decrease and a 50.98% month-over-month decrease.
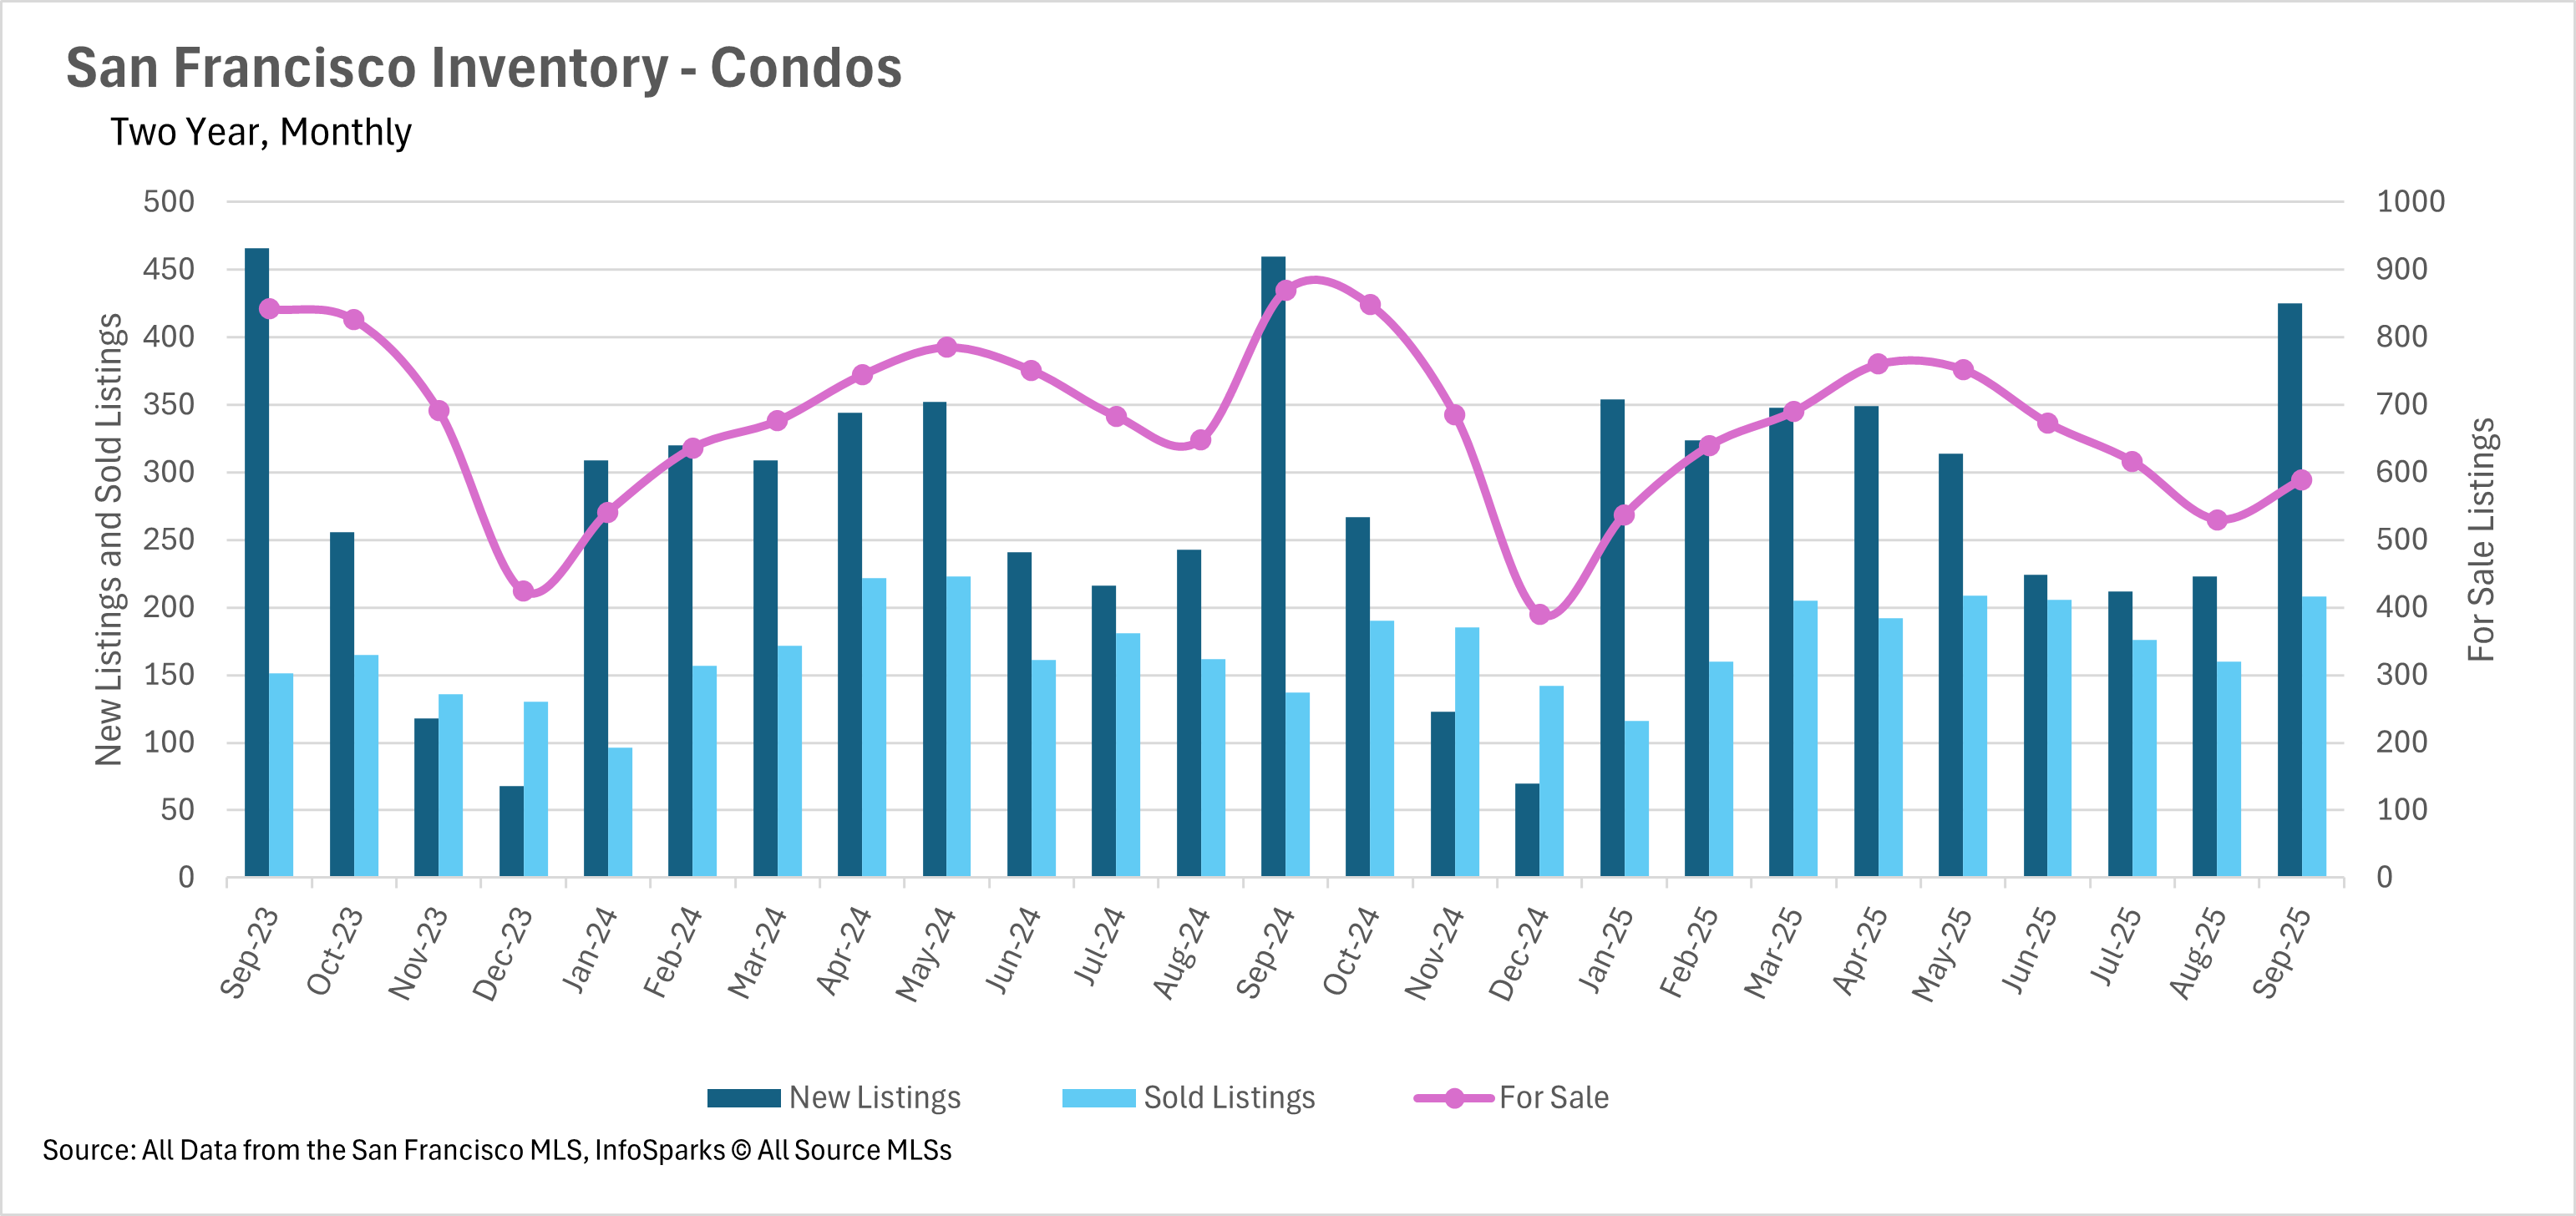
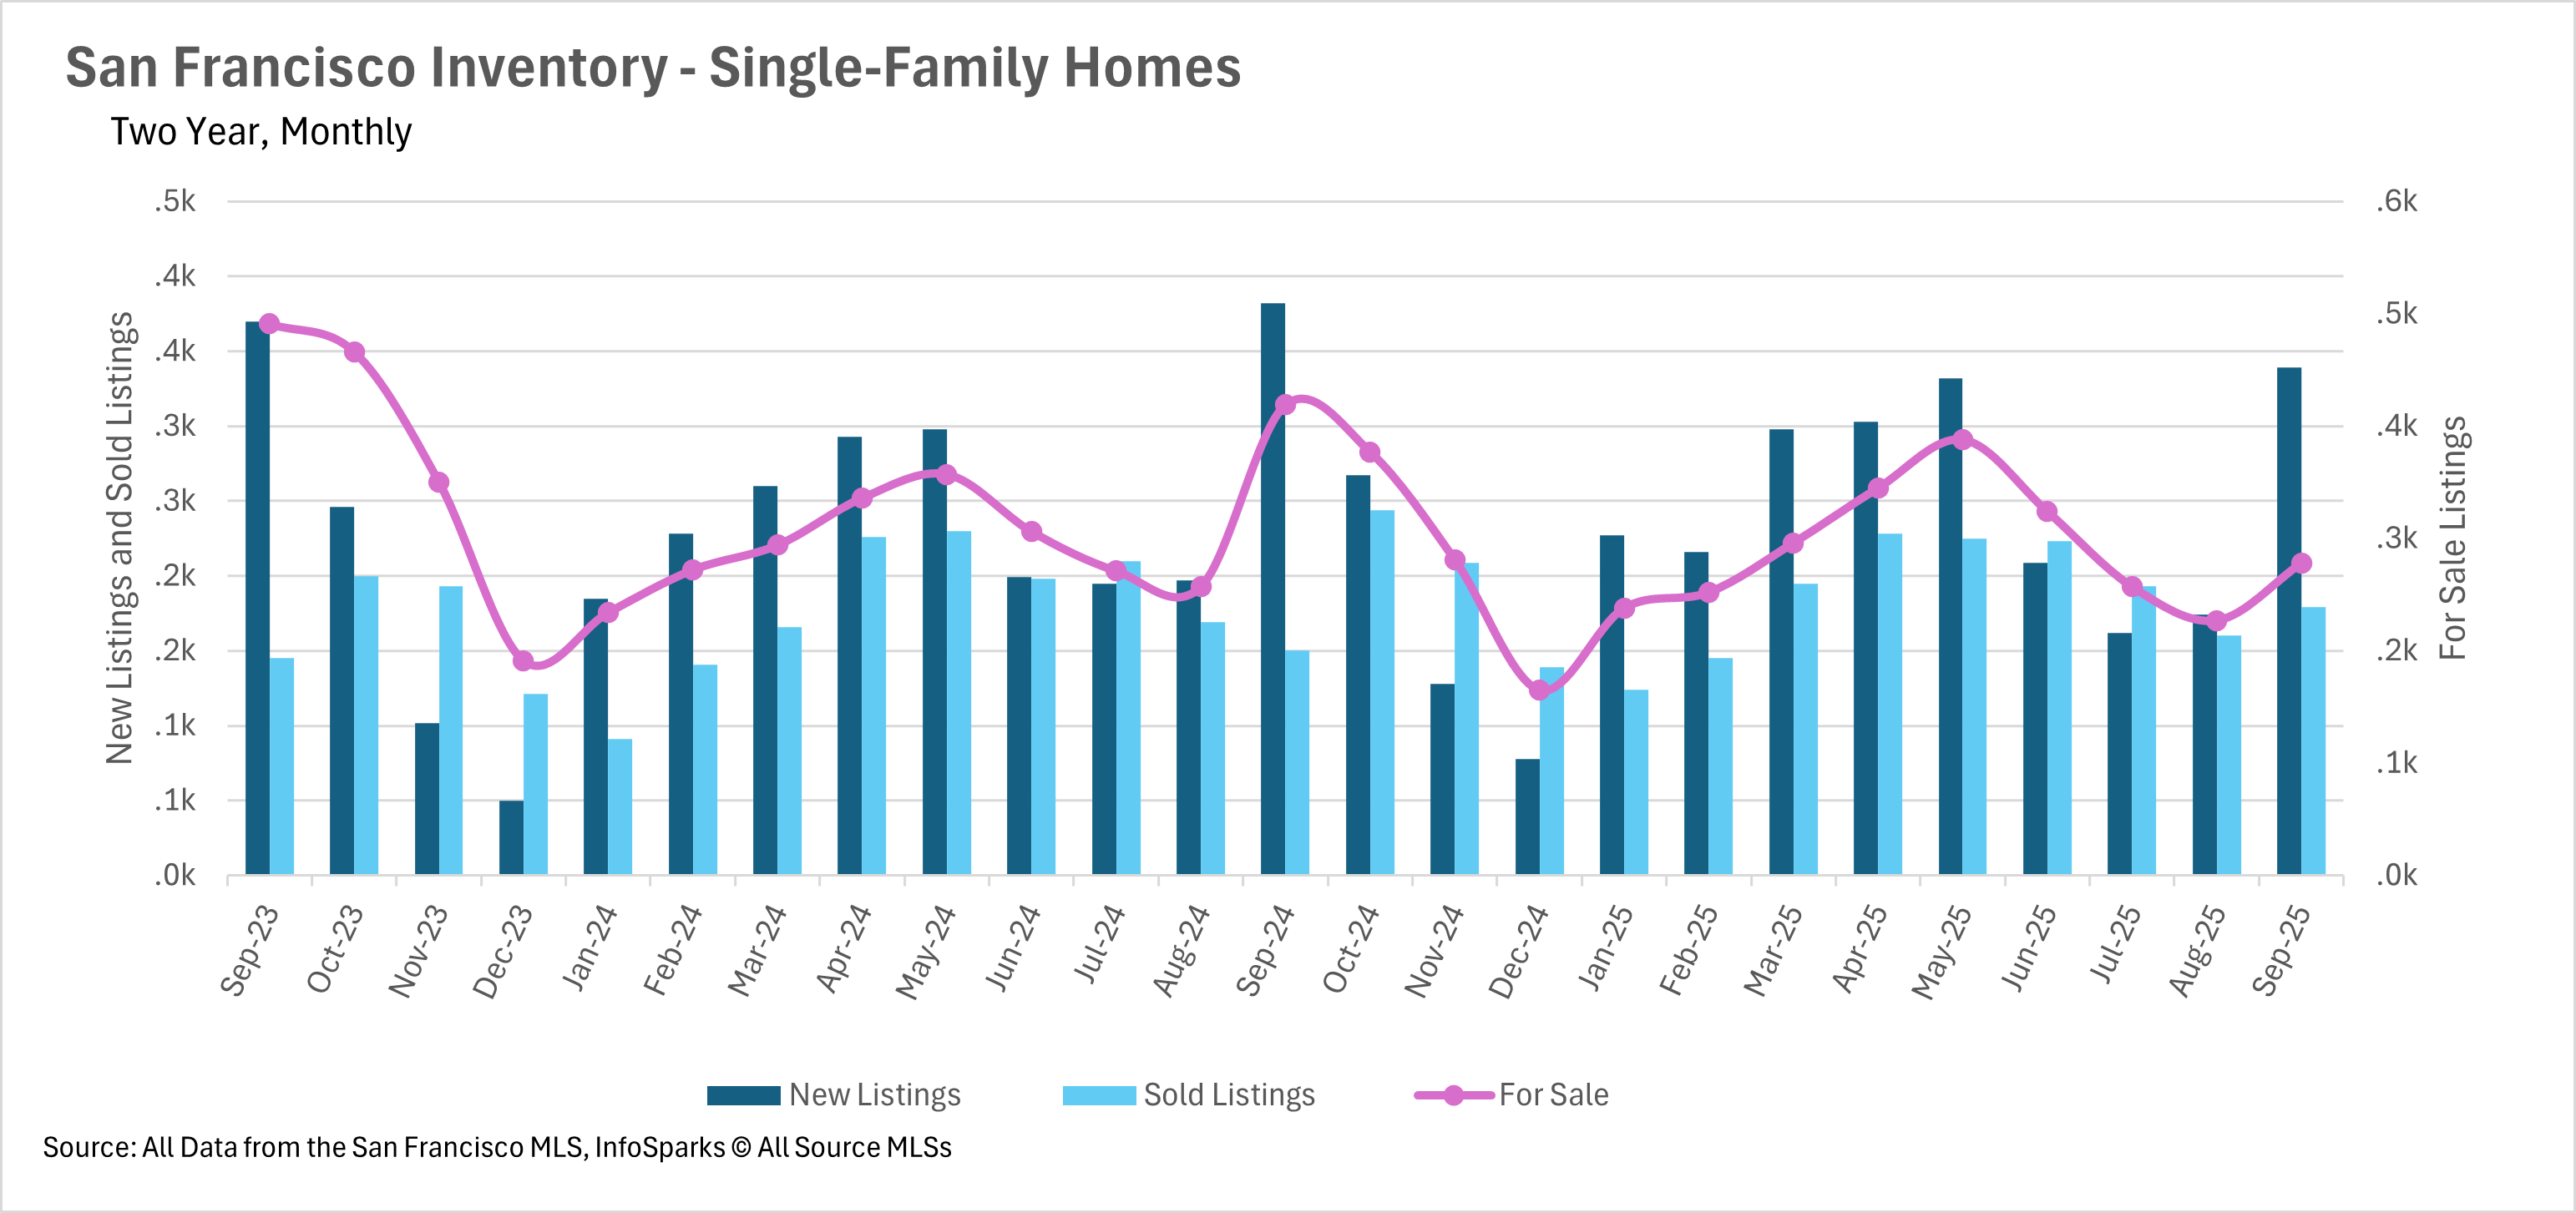
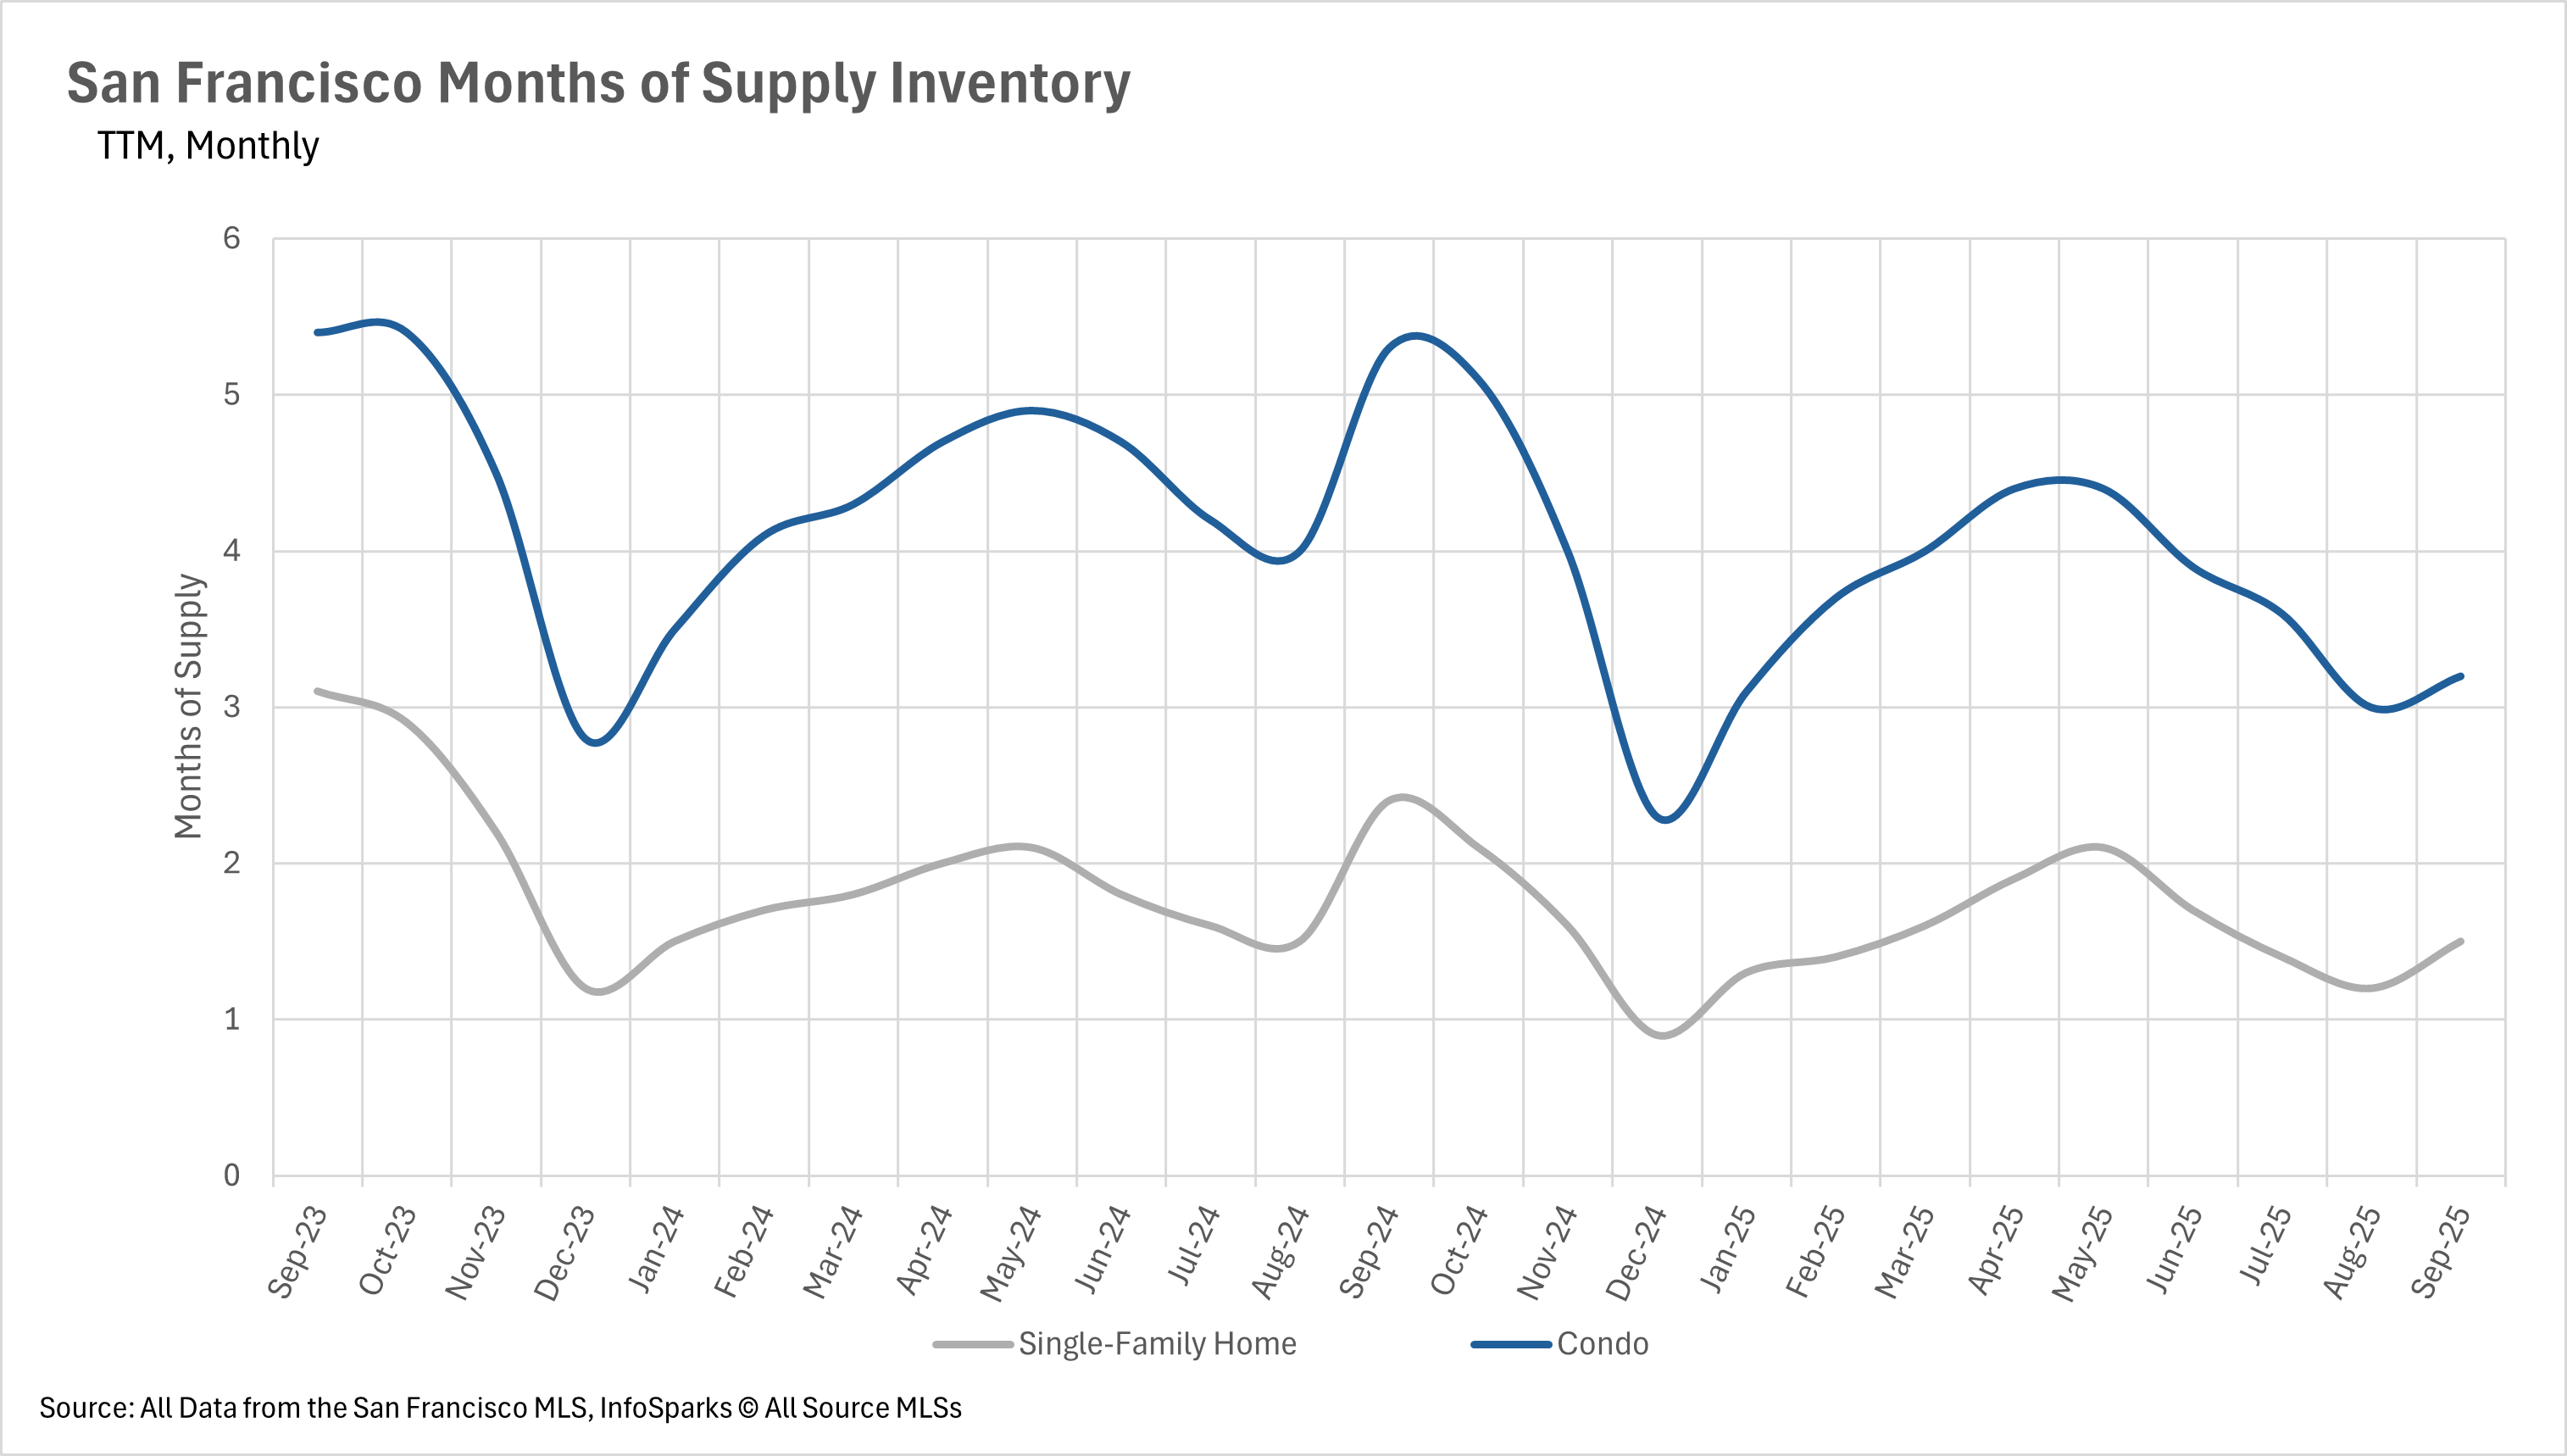
San Francisco Inventory - Condos and Single-Family Homes
When determining whether a market is a buyers’ market or a sellers’ market, we look to the Months of Supply Inventory (MSI) metric. The state of California has historically averaged around three months of MSI, so any area with at or around three months of MSI is considered a balanced market. Any market that has lower than three months of MSI is considered a seller’s market, whereas markets with more than three months of MSI are considered buyers’ markets.
While the single-family home market has been a heavily entrenched seller's market for quite some time (and it still is, with just 1.5 months of inventory on the market), the condo market has traditionally been more buyer-friendly. However, it’s been creeping closer toward being a seller's market as of late, with the condo market reporting just 3.2 months' worth of active inventory on the market in September.
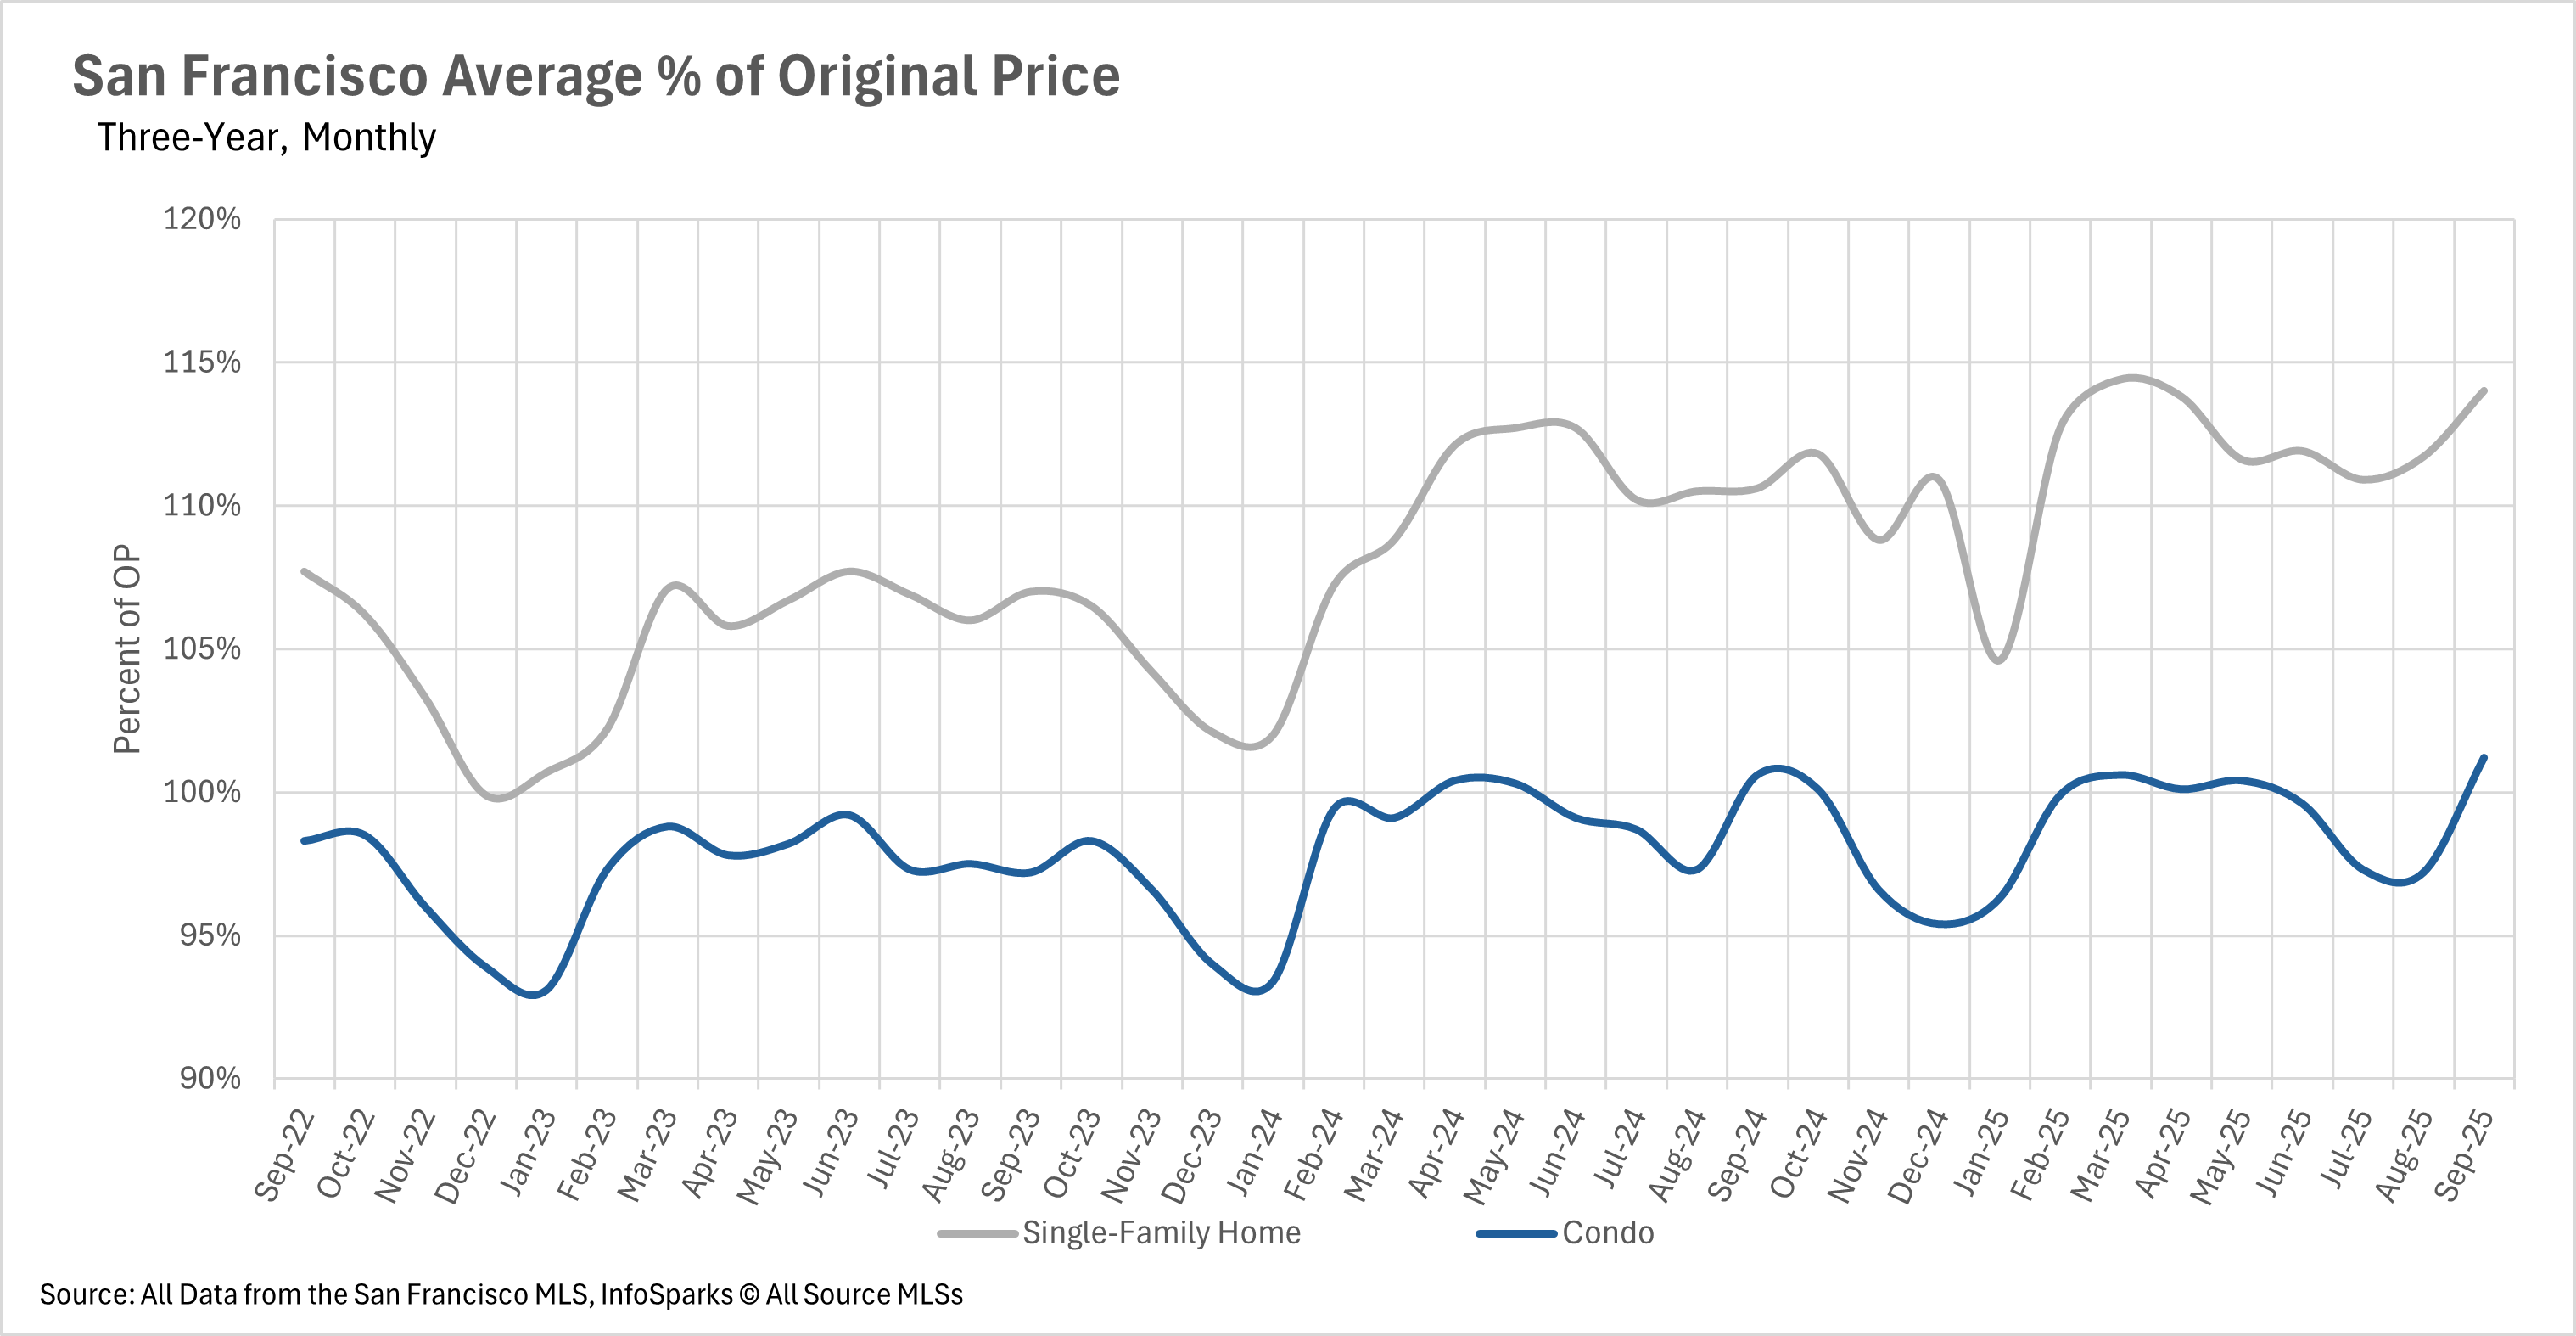
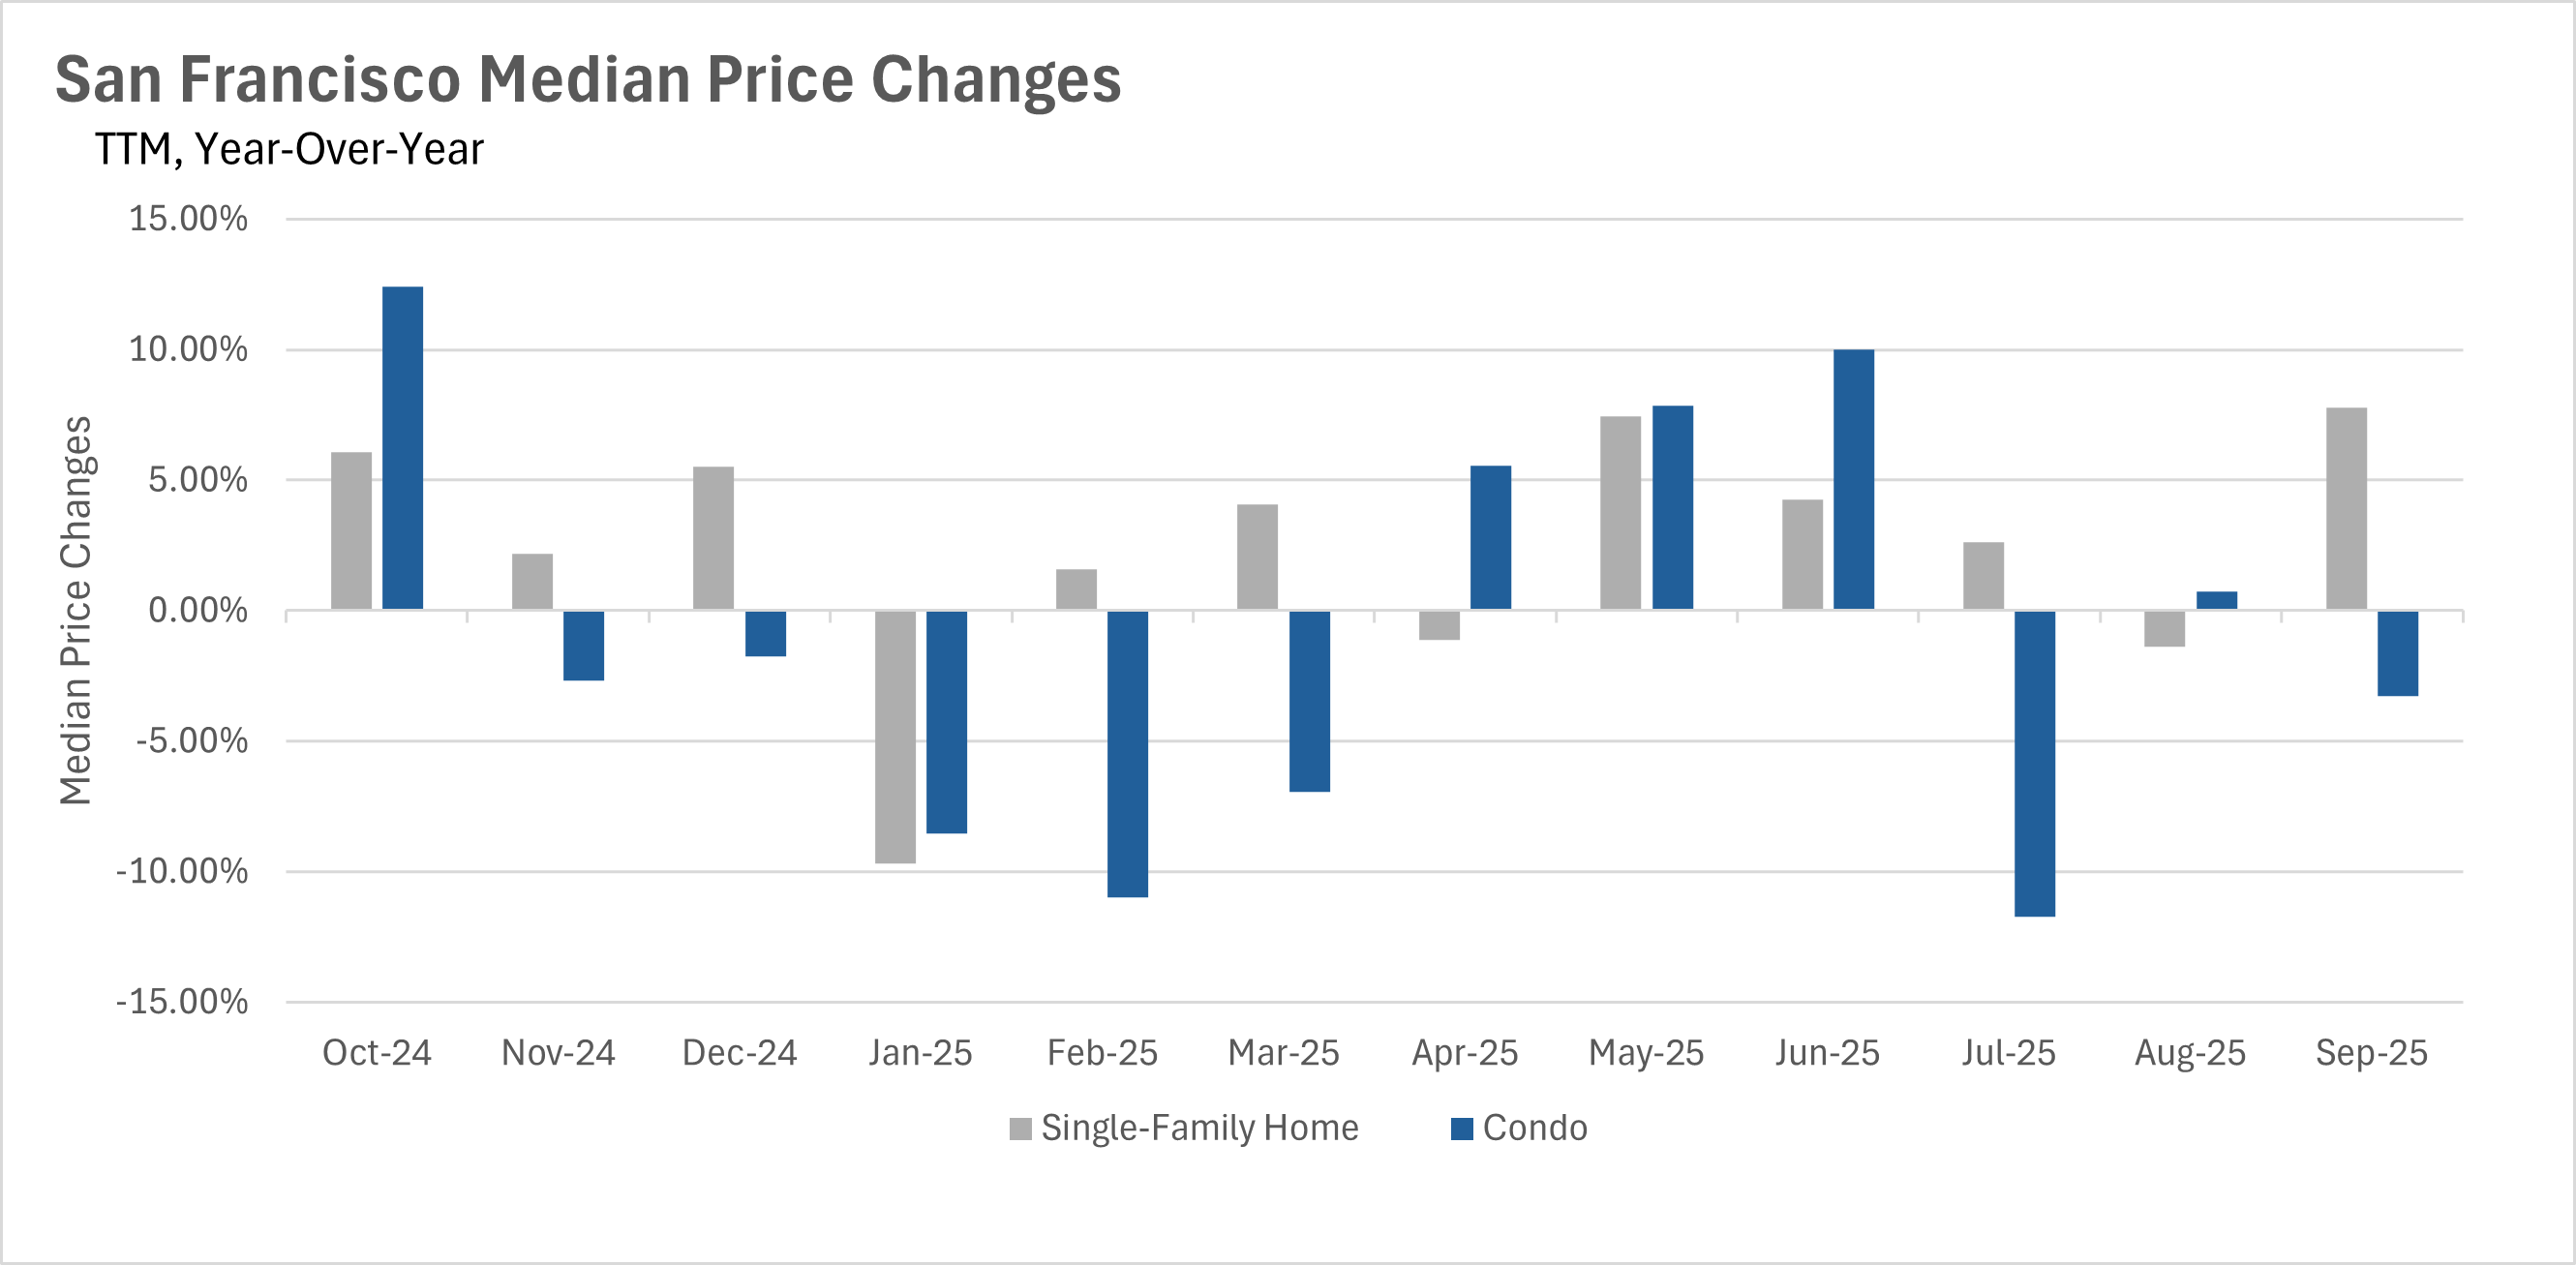
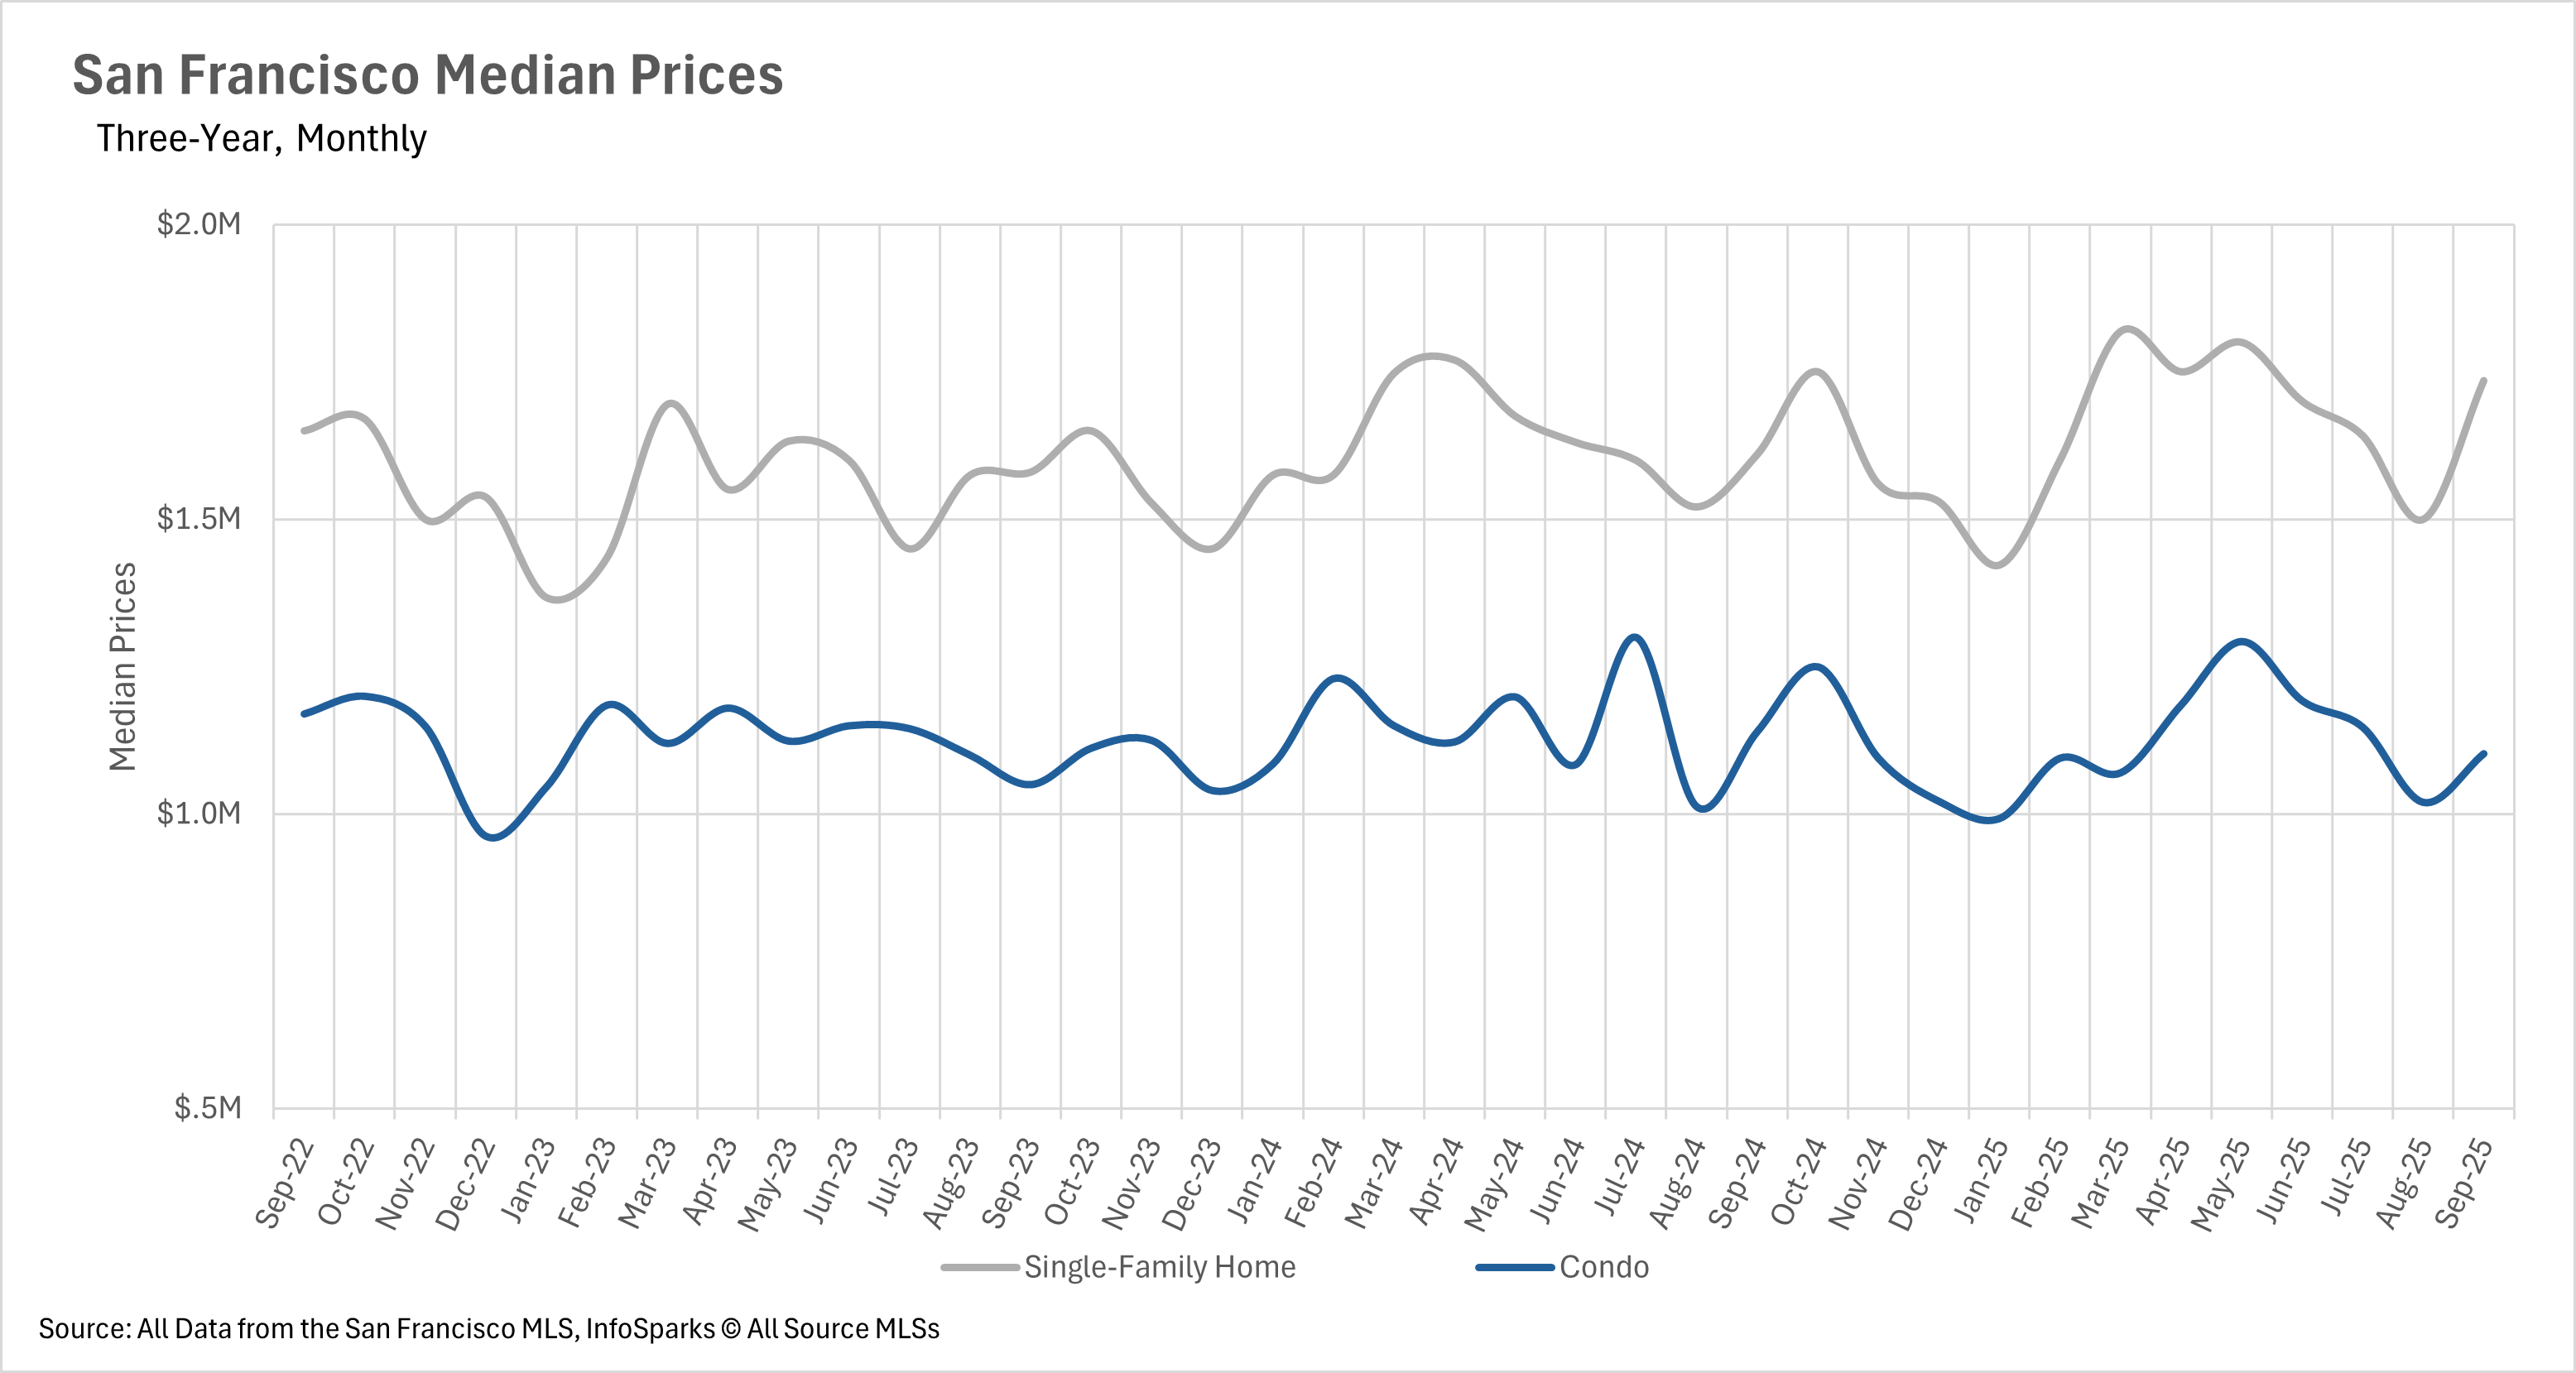
San Francisco Sales Prices
San Francisco’s single-family home market saw a notable upswing last month, with median sale prices rising 7.76% year-over-year—the largest gain we’ve seen so far this year. Inventory remains one of the city’s biggest challenges, with supply down 33.65% from a year ago. The condo market, meanwhile, experienced a 3.29% decline in median sale prices, yet the average condo is now selling slightly above its original list price—a shift not seen since May. Across both segments, low inventory continues to drive competitive conditions and price pressure.