

Spring Surprises in a Shifting Market
What’s Ahead for San Francisco Real Estate?
Spring is typically San Francisco’s most active real estate season, bringing a surge of listings and buyer activity. But in 2025, familiar patterns are giving way to market complexity. Inventory remains tight in many neighborhoods, price performance is mixed across property types, and macroeconomic pressures are reshaping buyer behavior. As we head into summer, the local market shows signs of resilience in some sectors and uncertainty in others. Below are some charts that track what the latest data tells us about where things stand and where we might be headed.
Rates remain front and center in every real estate conversation, and the latest signal from the Federal Reserve isn’t helping ease buyer anxiety. Officials are now suggesting rate cuts are unlikely before September, citing persistent inflation and growing uncertainty around the economic impact of new tariffs. That means mortgage rates are expected to stay elevated through the summer. Combined with affordability challenges, economic jitters, and shifting tech employment dynamics, many buyers are opting to pause, reassess, or negotiate more aggressively, adding a new layer of complexity to this year’s spring market.
And rates aren’t the only headliner in our news feeds - insurance has been getting its fair share of attention. The latest: State Farm, the state’s largest insurance company, received a green light to increase rates by an average of 17% starting in June. And, within a week after getting that approval, State Farm filed an additional request to bump that hike up to 30%, citing financial distress arising from the LA fires. The agency is also asking to raise condo rates by 36% and rental rates by 52%. More will be decided in October when the state insurance folks hold a public hearing to gather more evidence. (Mercury News)
According to the California Association of Realtors, just 17% of households in the state can currently afford a median-priced single-family home. When you factor in elevated interest rates and rising insurance costs, it’s no surprise that many buyers are pausing to reassess. While the full picture of this spring’s market has yet to emerge, one thing is clear: predictability is off the table.
If you're thinking about your next move—whether buying, selling, or simply staying informed—we're here to help. We also recommend looping in your financial advisor to take a more holistic approach to your real estate decisions. And if you’re looking for trusted wealth management guidance, we’d be happy to connect you with one of our outstanding partners.
Historical Trends in 30-Year Fixed Mortgage Rates
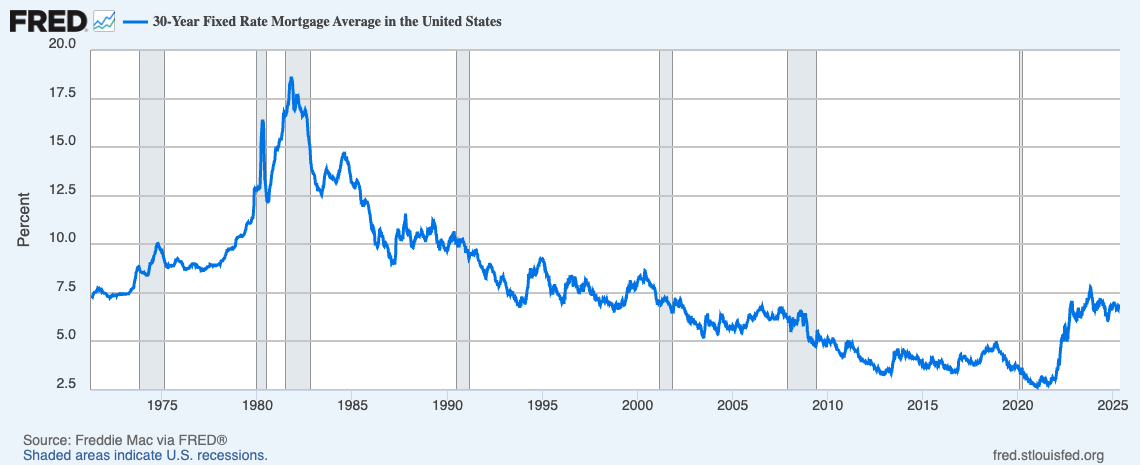
The 30-year fixed-rate mortgage average in the United States was 6.81% as of May 15. This chart from the Federal Reserve Bank of St. Louis (FRED) shows the historical trend of 30-year fixed mortgage rates in the United States from the early 1970s through 2025. Mortgage rates peaked in the early 1980s, reaching over 18% during a period of high inflation and aggressive Fed tightening. Since then, rates have trended downward for decades, hitting historic lows below 3% in 2020–2021 during the COVID-19 pandemic. However, beginning in 2022, rates rose sharply again, topping 7% in 2023 due to inflation concerns and Fed rate hikes. As of 2025, mortgage rates remain elevated compared to the previous decade but below the historical average.
U.S. Economic Indicators & Unemployment Rate
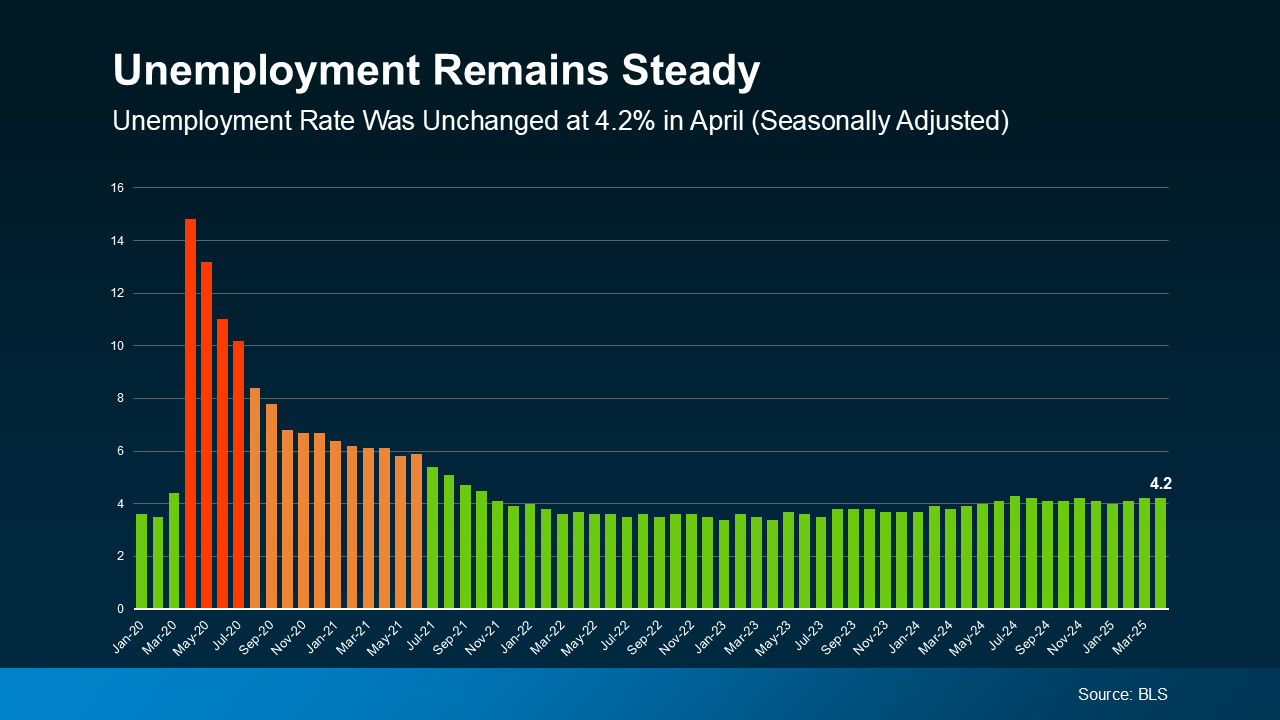
As of April 2025, the U.S. unemployment rate remained unchanged from the previous month at 4.2%. This is consistent with the range of 4-4.2% observed since May of last year (Bureau of Labor and Statistics). Even though the unemployment rate is holding steady, there are some warning signs on the horizon. The U.S. economy shrank just a bit in the first quarter of 2025—with GDP down 0.3%—and that’s got some folks talking about a possible recession. What’s fueling those concerns? Things like global tensions, new trade tariffs, higher mortgage rates, and record levels of household debt. That said, some of the usual red flags—like rising jobless claims or a big drop in consumer spending—haven’t really shown up yet (MarketWatch).
Inflation Trends and Economic Pressure Points
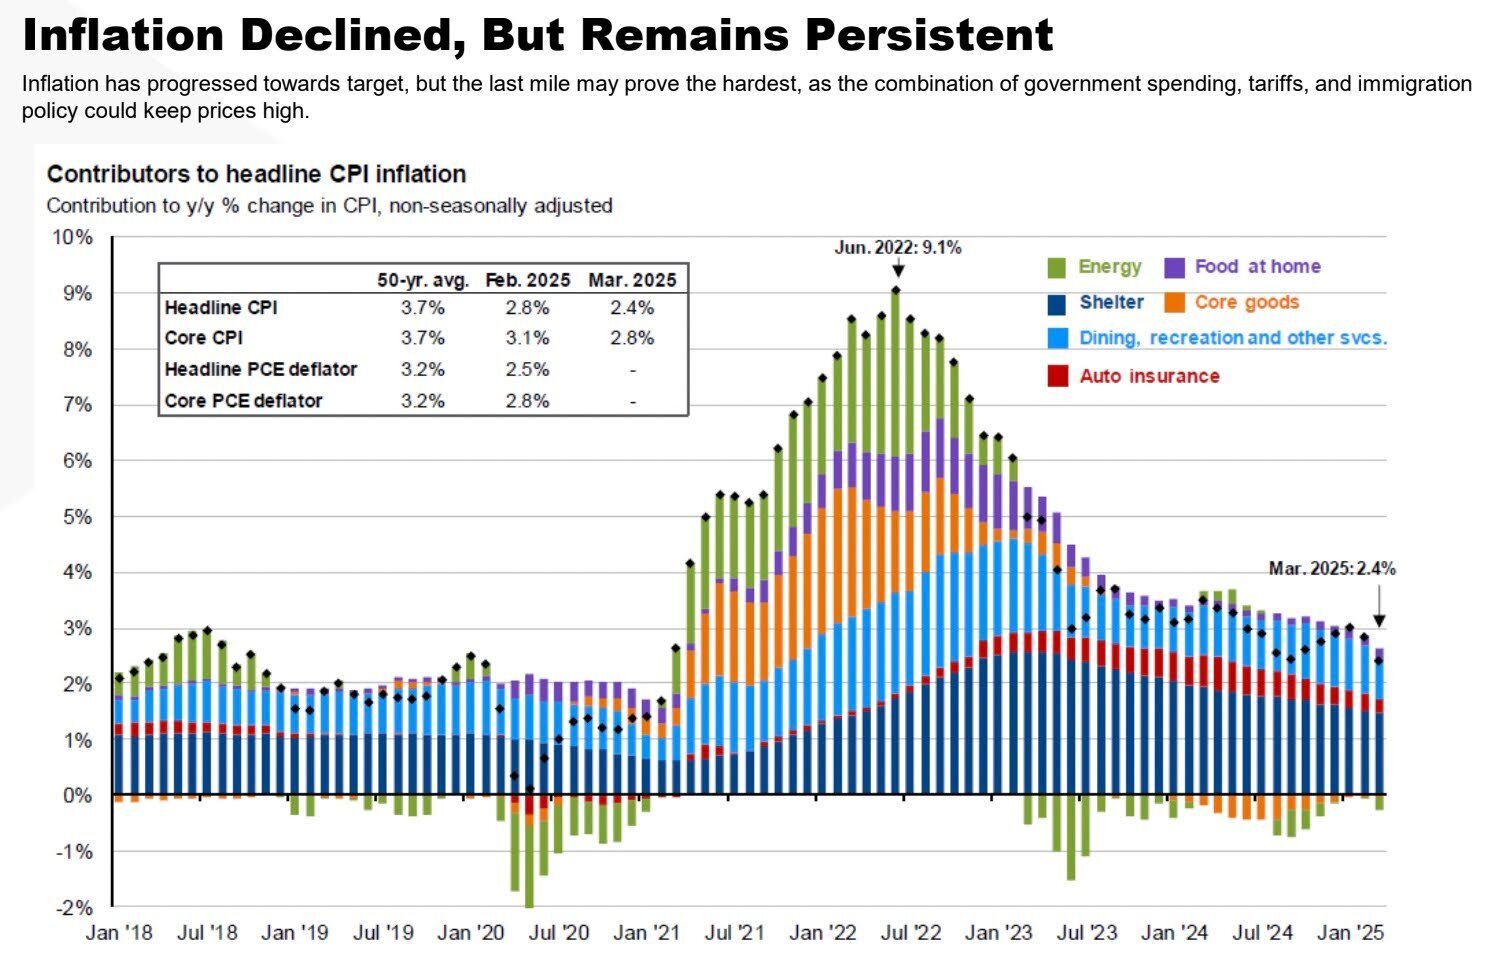
Inflation has been moving in the right direction, but the chart shows progress is starting to stall. Getting all the way back to the Fed’s target might be tough, especially with factors like government spending, new tariffs, and immigration policy still putting pressure on prices. (Parallel Advisors)
Shift in U.S. Housing Inventory Dynamics
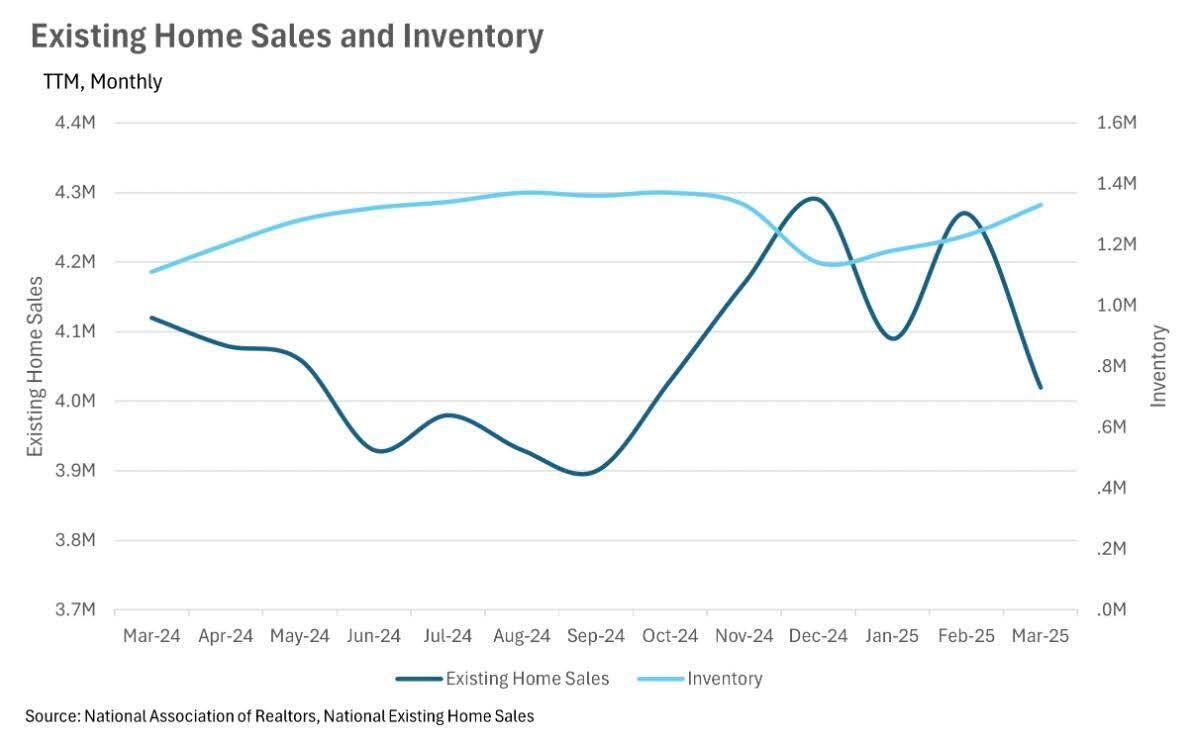
This chart highlights a notable shift in U.S. housing inventory. As of March 2025, the number of homes for sale rose to 1.33 million—an increase of nearly 20% compared to the same time last year, when inventory stood at 1.11 million. While it’s normal to see inventory build during the spring season, the year-over-year jump suggests more homeowners are listing, while buyers remain cautious. Despite this increase in supply, existing home sales declined slightly, down 2.43% from March 2024, totaling 4.02 million homes sold. The data reflects growing uncertainty among buyers nationwide, and it's visibly impacting market activity.
Residential Property Market Snapshot in San Francisco
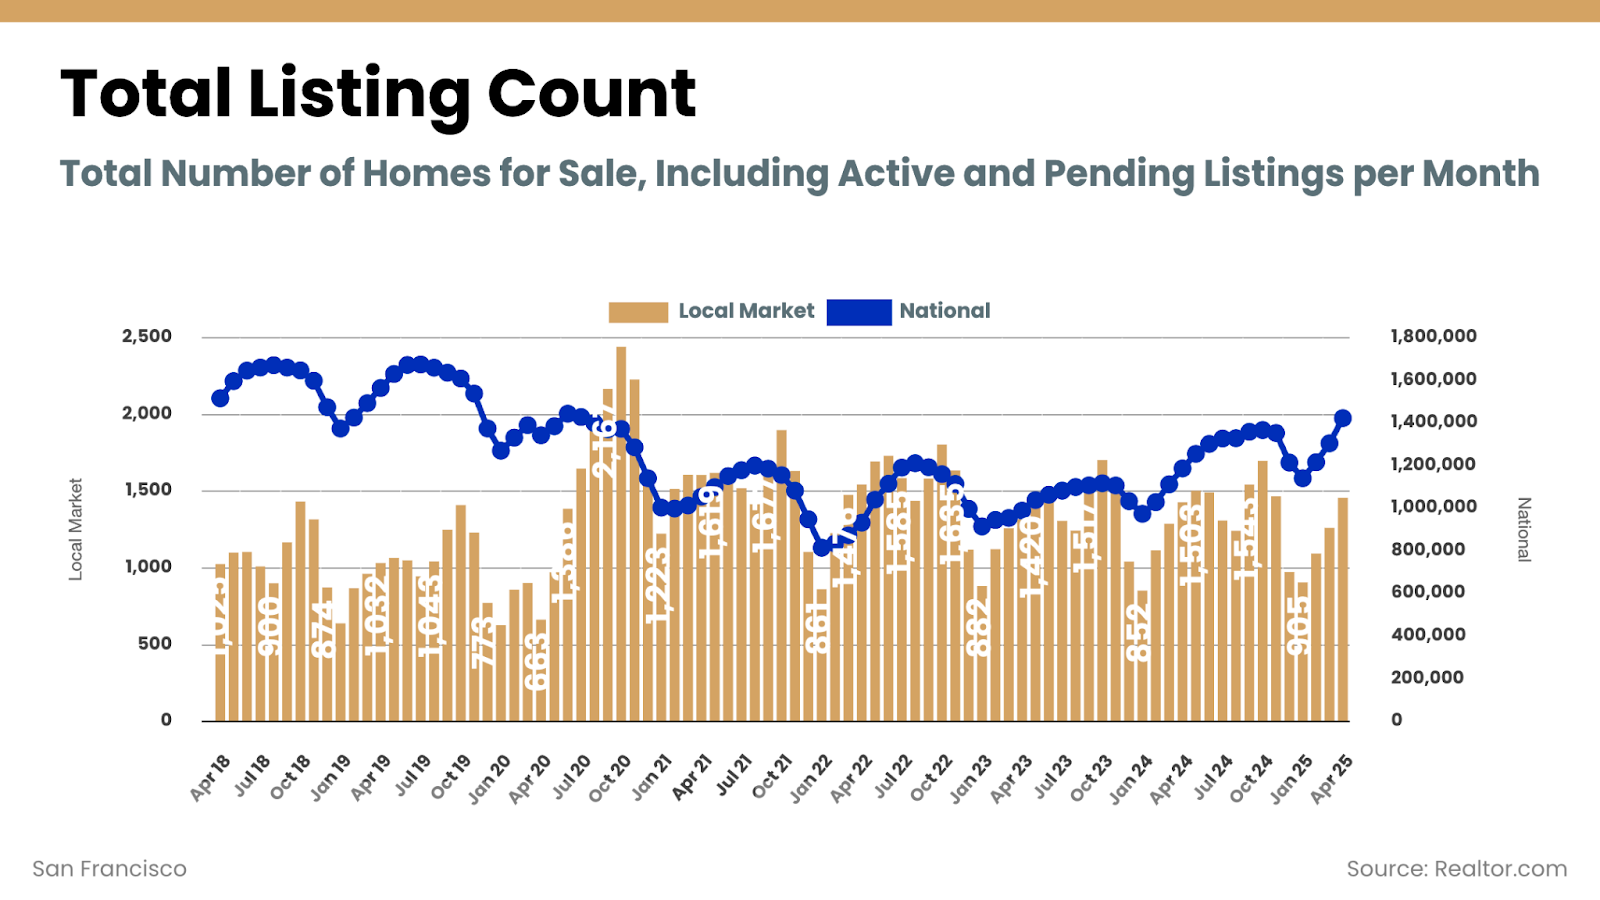
Here's a look at the total number of residential properties for sale in San Francisco as of May 20, 2025. There are a total of approximately 1450 properties available, about 200 more than last month, including homes, condos and multi-unit buildings.
Months of Supply Inventory (MSI) in San Francisco
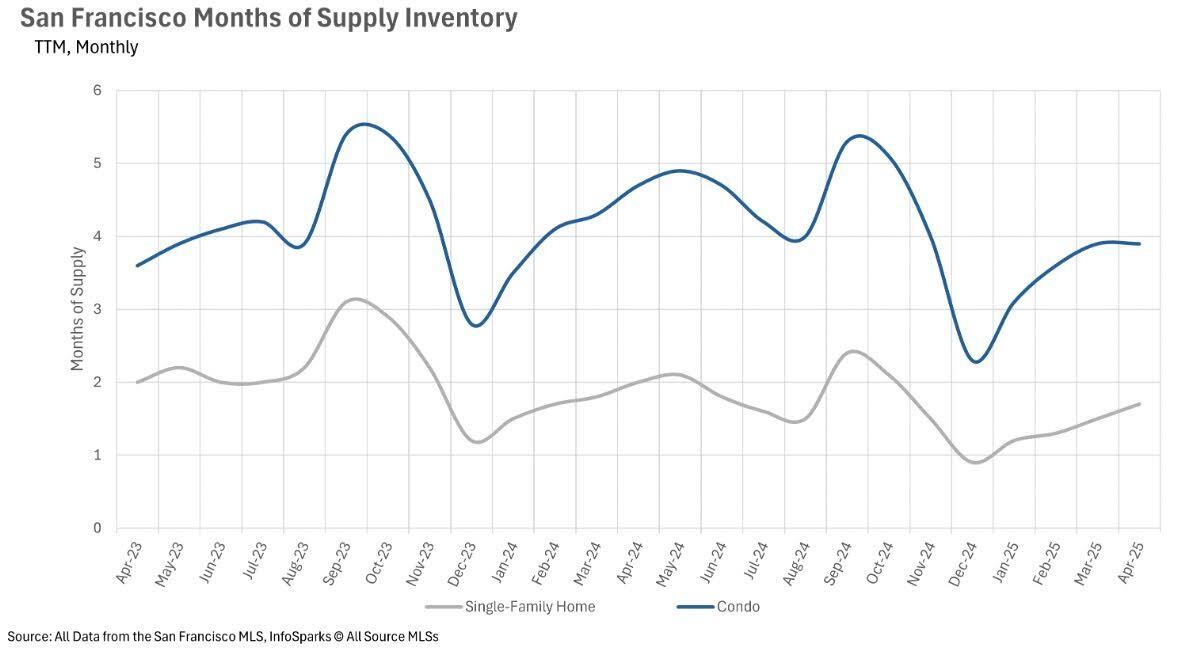
Months of Supply Inventory (MSI) helps determine whether a market favors buyers or sellers. MSI tells us how long it would take to sell all the homes currently on the market if no new listings came in. In California, a balanced market typically sits around 3 months of MSI—below that is a seller’s market, above is a buyer’s market. Despite overall inventory challenges, San Francisco tells a split story. The single-family home market remains a seller’s market with just 1.7 months of supply, while the condo market leans toward buyers, with approximately 3.9 months of inventory currently available.
Median Sales Price Trends for Single-Family Homes in San Francisco
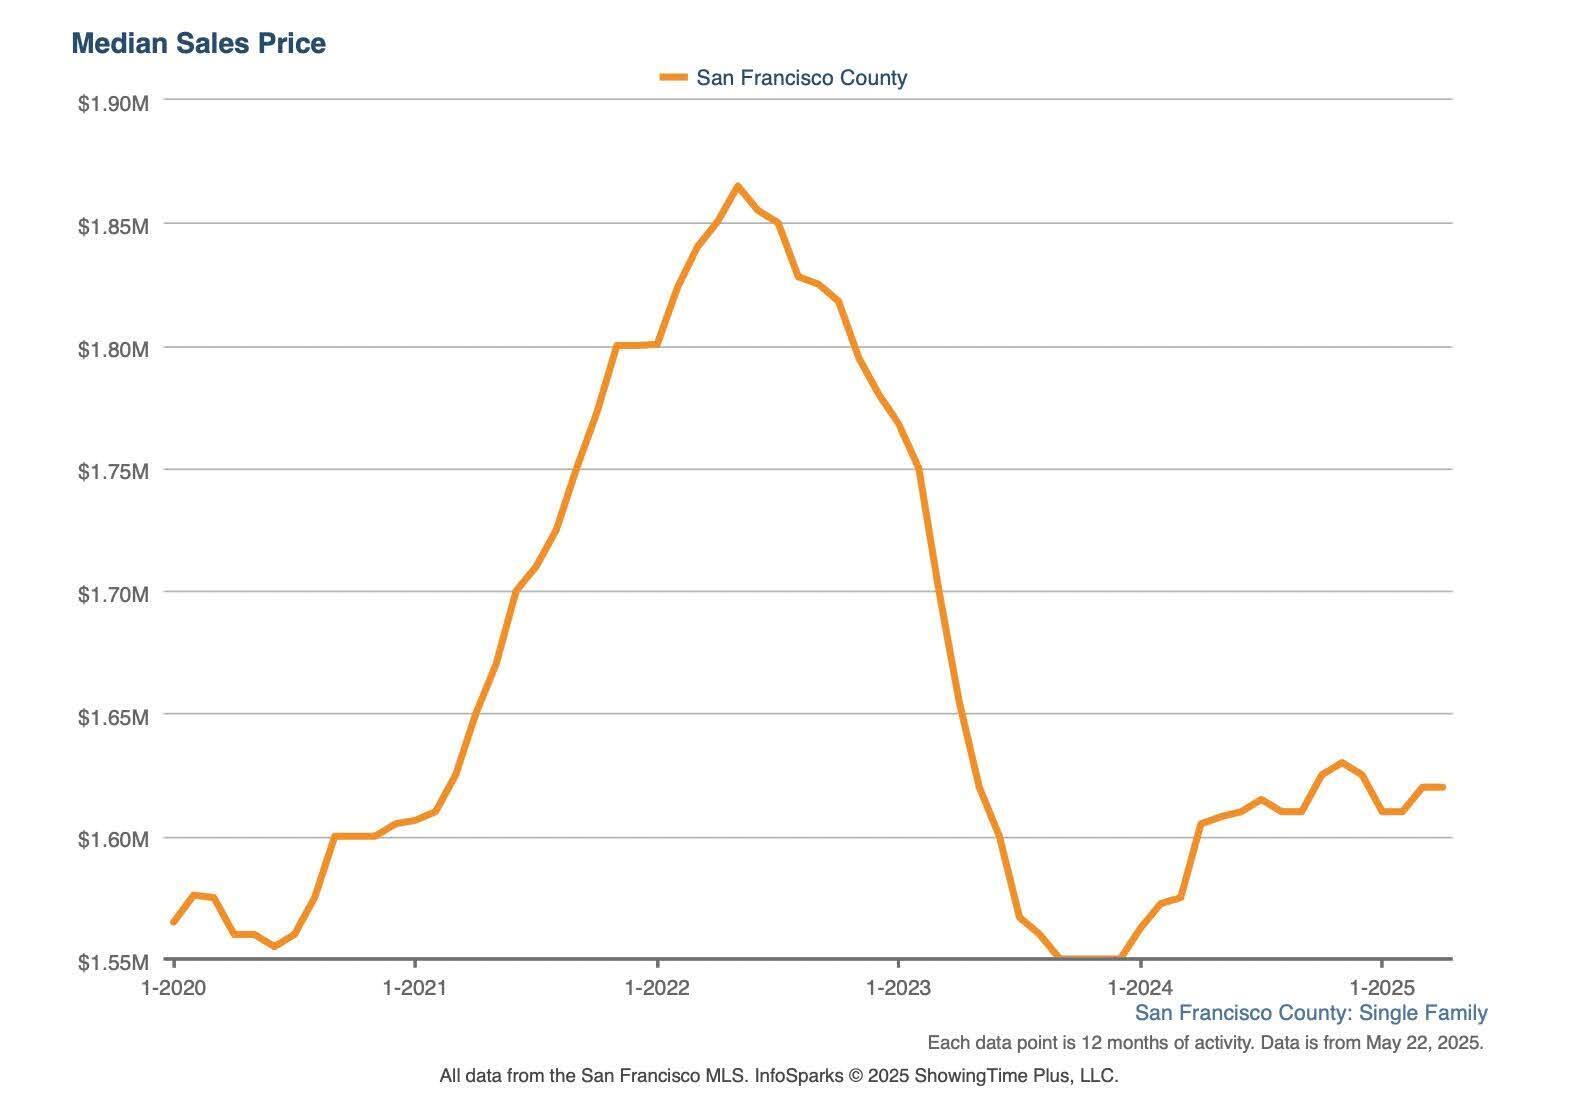
The chart below shows the rolling 12-month median sales price for single-family homes in San Francisco from 2020 through May 20, 2025. While overall prices remain relatively strong, the market continues to reward homes that align with buyer priorities—think great location, functional floor plan, outdoor space, good condition, and parking. Well-presented and appropriately priced homes are attracting solid interest. On the other hand, overpriced listings—especially those anchored to 2021–2022 peak comparisons—are seeing limited traction.
Median Sales Price Trends for Condos in San Francisco
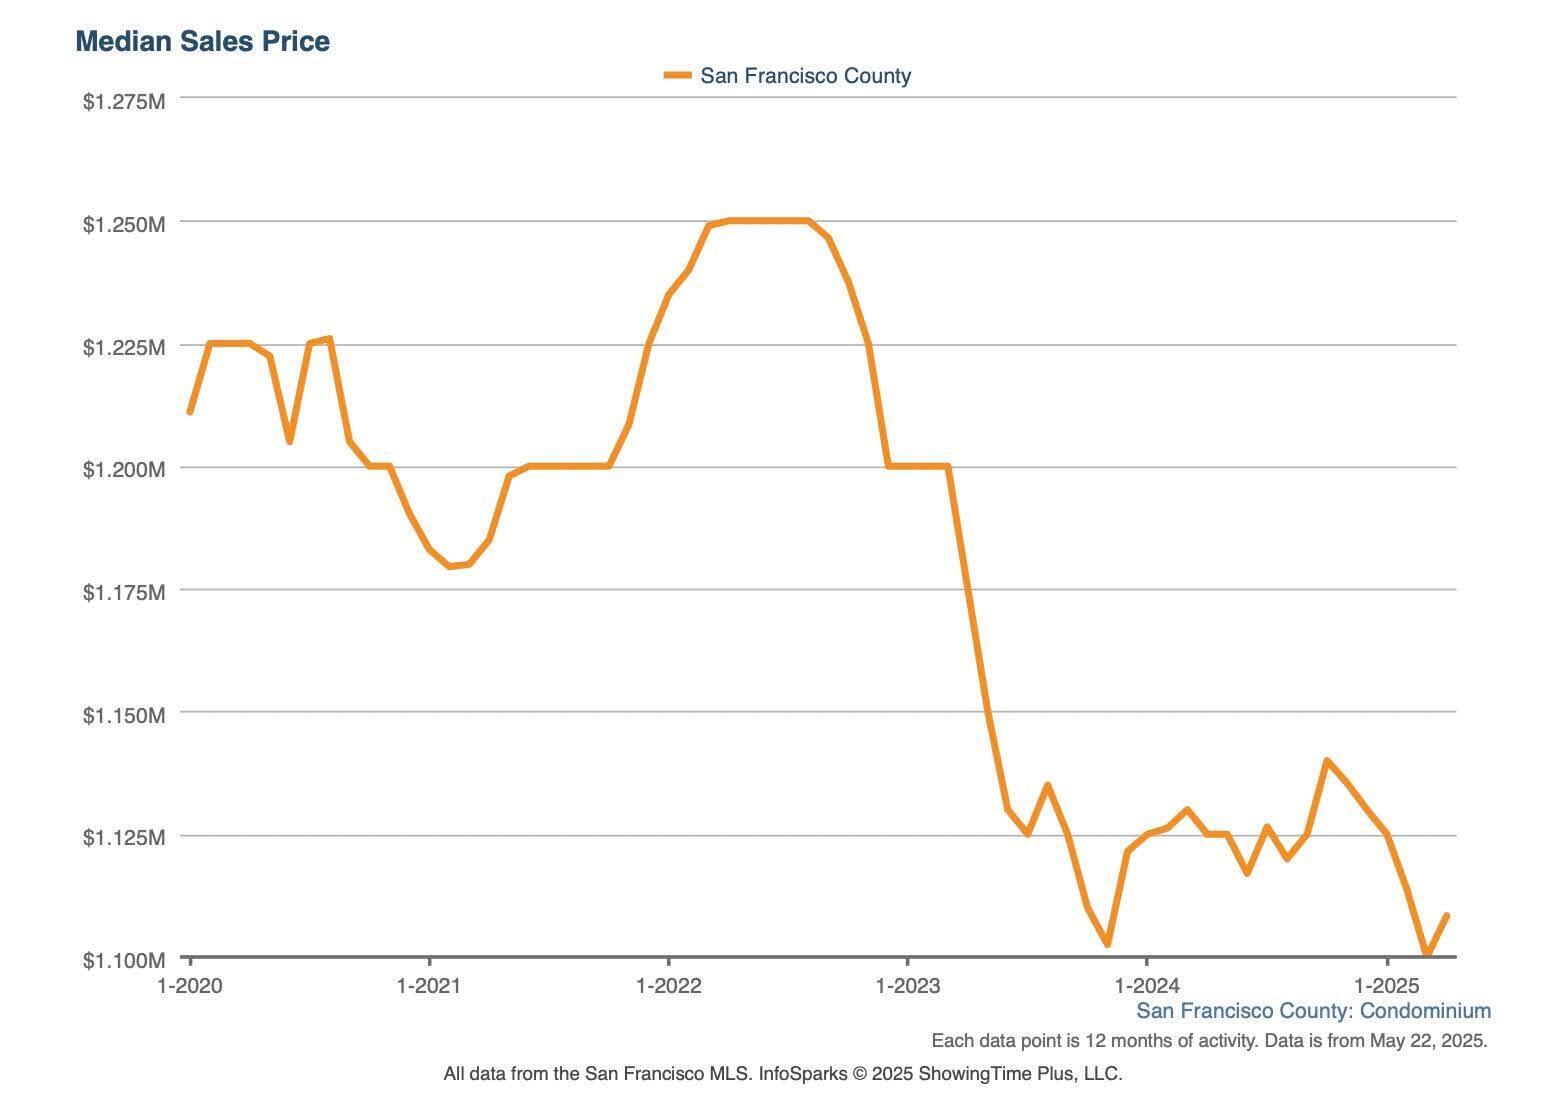
The chart below tracks the rolling 12-month median sales price for San Francisco condos from 2020 through May 20, 2025. While the current median sits at $1.108M—still below the $1.25M peak of May 2022—this recent uptick could signal a turning point for the condo market. Buyers are beginning to reengage, especially for units that offer compelling value, thoughtful layouts, and desirable locations.
Parental Assistance and Homebuying Trends Among Young Adults
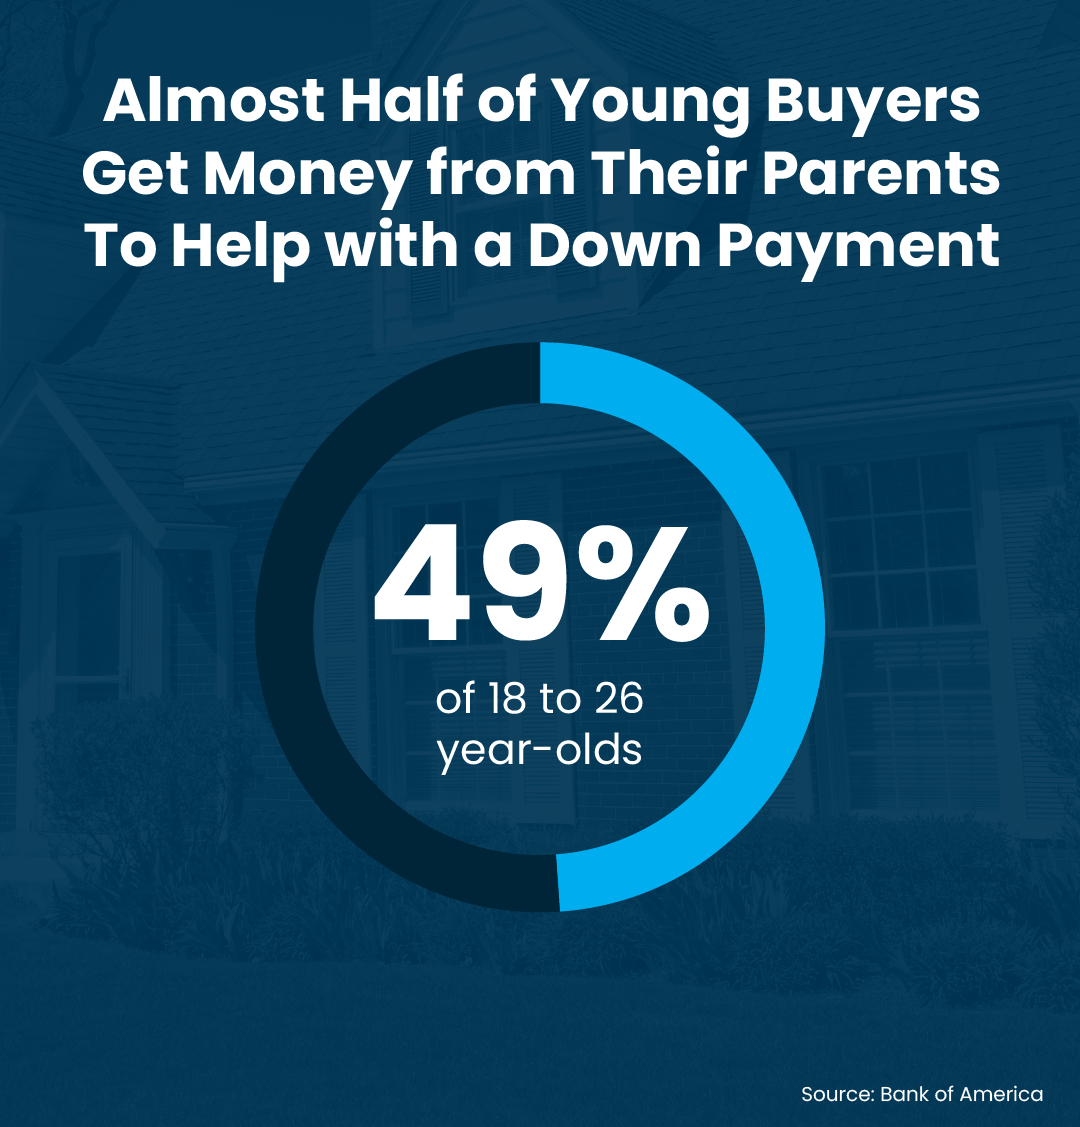
Did you know that nearly half of young homebuyers, age 18-26, get down payment assistance from their parents? Many of these parents are tapping into their home equity to help their children buy a home. Right now, the average homeowner has over $300k in equity.