July Market Snapshot
Mid-Year Update
As we move through mid-July, the housing market remains in a state of adjustment. Higher mortgage rates have reshaped buyer demand, while many homeowners stay put, locked into lower rates. In the Bay Area, job cuts and persistent inflation add to the uncertainty, with interest rates stubbornly elevated, relatively speaking. Despite these headwinds, opportunities still exist for those who understand how to navigate this shifting landscape.
-
Mortgage Rates: As of July 18, the average 30-year fixed rate was 6.75%, up from 6.67% at the beginning of July. With rates expected to hold steady and inventory levels starting to improve, buyers who’ve been on the sidelines may find now is the time to act, despite ongoing affordability concerns.
-
Job Cuts: Bay Area employers cut 6,800 jobs in June, marking the region’s second consecutive month of losses, according to the state Employment Development Department. All three major metro areas - San Francisco-San Mateo, the East Bay, and the South Bay - saw declines. In the first half of 2025 alone, the region shed over 24,000 jobs. Statewide, California now shares the highest unemployment rate in the nation with Nevada.
-
Inflation: Inflation is creeping back up, with June’s Consumer Price Index (CPI) showing a 2.7% annual increase, driven by rising shelter costs and new tariffs that are pushing prices even higher. For buyers, this means continued pressure on affordability as both home prices and everyday expenses remain elevated. For sellers, it signals a market where buyers are more price-sensitive, making accurate pricing and strong marketing essential. With the Fed holding interest rates steady to combat inflation, today’s market calls for smart, strategic decisions on both sides of the transaction.
-
Homeowners Staying Put: According to a June Redfin survey, a third of Baby Boomers say they’ll never sell their home. The top reasons? Most simply love where they live (55%), many have paid off or nearly paid off their mortgage (20%), some think home prices are too high to buy again (16%), and a smaller group don’t want to give up their low mortgage rate (8%). We’ll see how this “Baby Boomer Effect” translates to listing inventory in the years to come.
-
Loan Origination Volume is on the Rise: JPMorgan Chase and Wells Fargo posted strong mortgage origination gains in Q2 2025, outpacing seasonal forecasts. But tighter margins and ongoing rate volatility point to a still-fragile market beneath the volume boost.
-
San Francisco Housing Prices: San Francisco’s median residential sales price in June 2025 was $1.465 million, a slight dip from $1.5 million in May. Still, prices are up 2% from June 2024’s median of $1.437 million. These figures include all residential property types—single-family homes, condos, and tenancy-in-common units—highlighting some market resilience despite economic headwinds. See the charts below for more information regarding specific property types.
Mortgage Rates
Mortgage rates have been relatively stable in recent months, holding within a narrow half-point range since late last year. While there’s still movement, the dramatic swings of the past are no longer the norm. As HousingWire notes, this has been “one of the most calm periods for mortgage rates in recent memory.” As of July 17, the average 30-year fixed rate stands at 6.75%, and the 15-year at 5.92%, according to Freddie Mac. Their long-term graph shows how today’s rates compare to historical highs in the 1980s and the record lows of 2021—offering important context for buyers navigating today’s market.
Mortgage Rate Predictions
If you’ve been waiting for the perfect mortgage rate, it may be time to act. Rates have hovered in the mid-6% range for months, offering rare stability. As of July 11, the 30-year fixed rate sits at 6.8%, and forecasts from Fannie Mae, MBA, and Wells Fargo all project rates to remain in the 6’s through at least the end of 2026. With more predictability, improving inventory, and slowing price growth, buyers today may be better positioned than they realize.
Employment Numbers
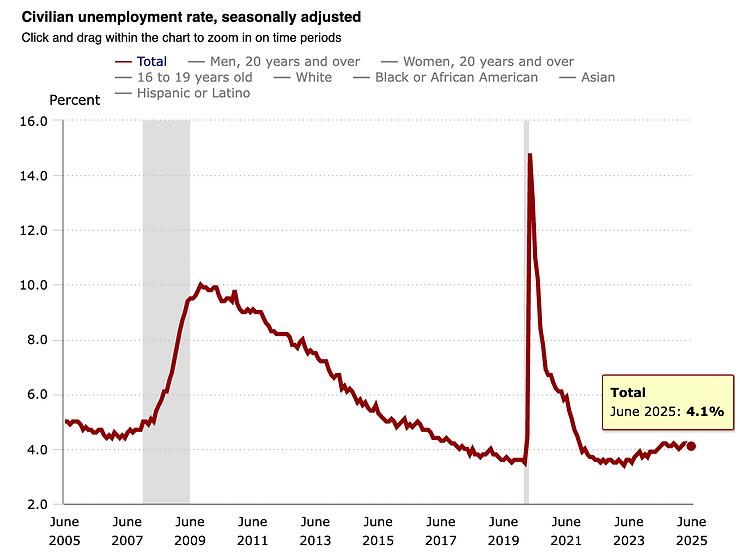
This graph shows the seasonally adjusted U.S. unemployment rate from June 2005 to June 2025, with sharp spikes during the Great Recession and the COVID-19 pandemic, when it briefly topped 14%. Since then, the rate has declined and stabilized around 4%, with June 2025 at 4.1%. However, the Bay Area saw 6,800 job losses in June—its second month of declines—impacting all major metro areas. These job cuts may seem at odds with San Francisco’s broader momentum: AI investment is surging, premium office space is filling, and redevelopment is reshaping the city into a more vibrant, mixed-use hub. (Sources: Bureau of Labor Statistics, Employment Development Department)
Inflation and Consumer Price Index
Inflation accelerated in June, with the Consumer Price Index rising 2.7% year-over-year—the fastest pace since February and up from 2.4% in May, according to the Bureau of Labor Statistics. Core inflation, which excludes food and energy, climbed to 2.9%. Analysts point to President Trump’s new tariffs as a key driver, adding upward pressure on prices. For homebuyers and sellers, this keeps the Federal Reserve on track to hold interest rates steady—meaning mortgage rates are likely to stay in the 6% range for now.
Boomers Staying Put
The data from a recent Redfin survey underscores a generational divide in home-selling intentions: nearly half of Silent-Generation (born 1928-1945) owners (45%) and roughly one-third (34%) of Baby Boomers (born 1946-1964) say they’ll never sell, effectively locking in a big chunk of existing inventory. By contrast, Millennials (born 1981-1996) and Gen Z (born 1997-2012) owners are the most mobile, with 17% open to selling within three years and another 16% in the three-to-five-year window. Gen X (born 1965-1980) falls between the two extremes, but a solid 31% still don’t expect to move for at least a decade. In short, older owners’ reluctance to list continues to constrain supply, while younger generations remain the primary source of future turnover.
Loan Origination Volume
This graph, sourced from the Federal Reserve Bank of Philadelphia via FRED, illustrates large bank consumer mortgage originations (new home loans) from 2012 to 2025. After a decline in originations between 2013 and 2014, the market saw fluctuating recovery, with significant growth from 2019 through early 2021—peaking at over $200 billion. However, beginning in 2022, originations sharply declined, hitting a low point in 2023 amid rising interest rates. As of 2025, the data shows a modest rebound, suggesting a potential recovery in mortgage lending activity.
National Housing Data
On a national scale, fewer homes are being sold, with 1.95% fewer existing home sales compared to this time last year. At the same time, 9.95% more new listings have hit the market on a year-over-year basis. This has led overall inventory to increase by a whopping 20.31% year-over-year. As inventory piles up, negotiating power will slowly shift from sellers to buyers, as buyers have more opportunities and don’t need to move nearly as quickly as they had to just a year earlier.
Housing Affordability
Housing affordability has remained a persistent challenge nationwide, and a return to pre-pandemic levels seems increasingly unlikely in the near term. In April, the median monthly principal and interest (P&I) payment rose 10.15% year-over-year to $2,182—a sharp 3.46% increase from the previous month alone. This surge is particularly striking given that mortgage rates have declined and median home sale prices have risen only modestly, up just 1.34% year-over-year. The disconnect highlights the complex and stubborn nature of today's affordability crisis.
San Francisco Single-Family Home Data
The median sales price for a condominium in San Francisco in May was $1,290,000, up 10% from April. Sales volume was up from the prior month by 3.8% to 193 condo sales. The median days on market climbed month-over-month by 11.8% to 57 days. It’s important to note that the condo months’ supply of inventory, the amount of time it would take the current listings to be absorbed by the market, is 4.08, generally suggesting a more balanced market. (Realtors’ Property Resource)
San Francisco Condominium Data
As of mid-June, the median sales price for a San Francisco condominium was $1,225,000, up from $1,200,000 in May, and up approximately 9.9% from June 2024’s median of $1,115,000. The sales volume has remained steady, with 605 sales in June, 604 in May and 606 sales in June 2024. The days on market (DOM) remain relatively unchanged month-over-month, with condos taking 29 days to sell in June and 27 the month prior. This is slightly better than the 31 DOM reported in June 2024. (San Francisco MLS/Info Sparks, 3-month rolling sales)