
September feels like one of those months when the headlines and the housing data are telling very different stories.
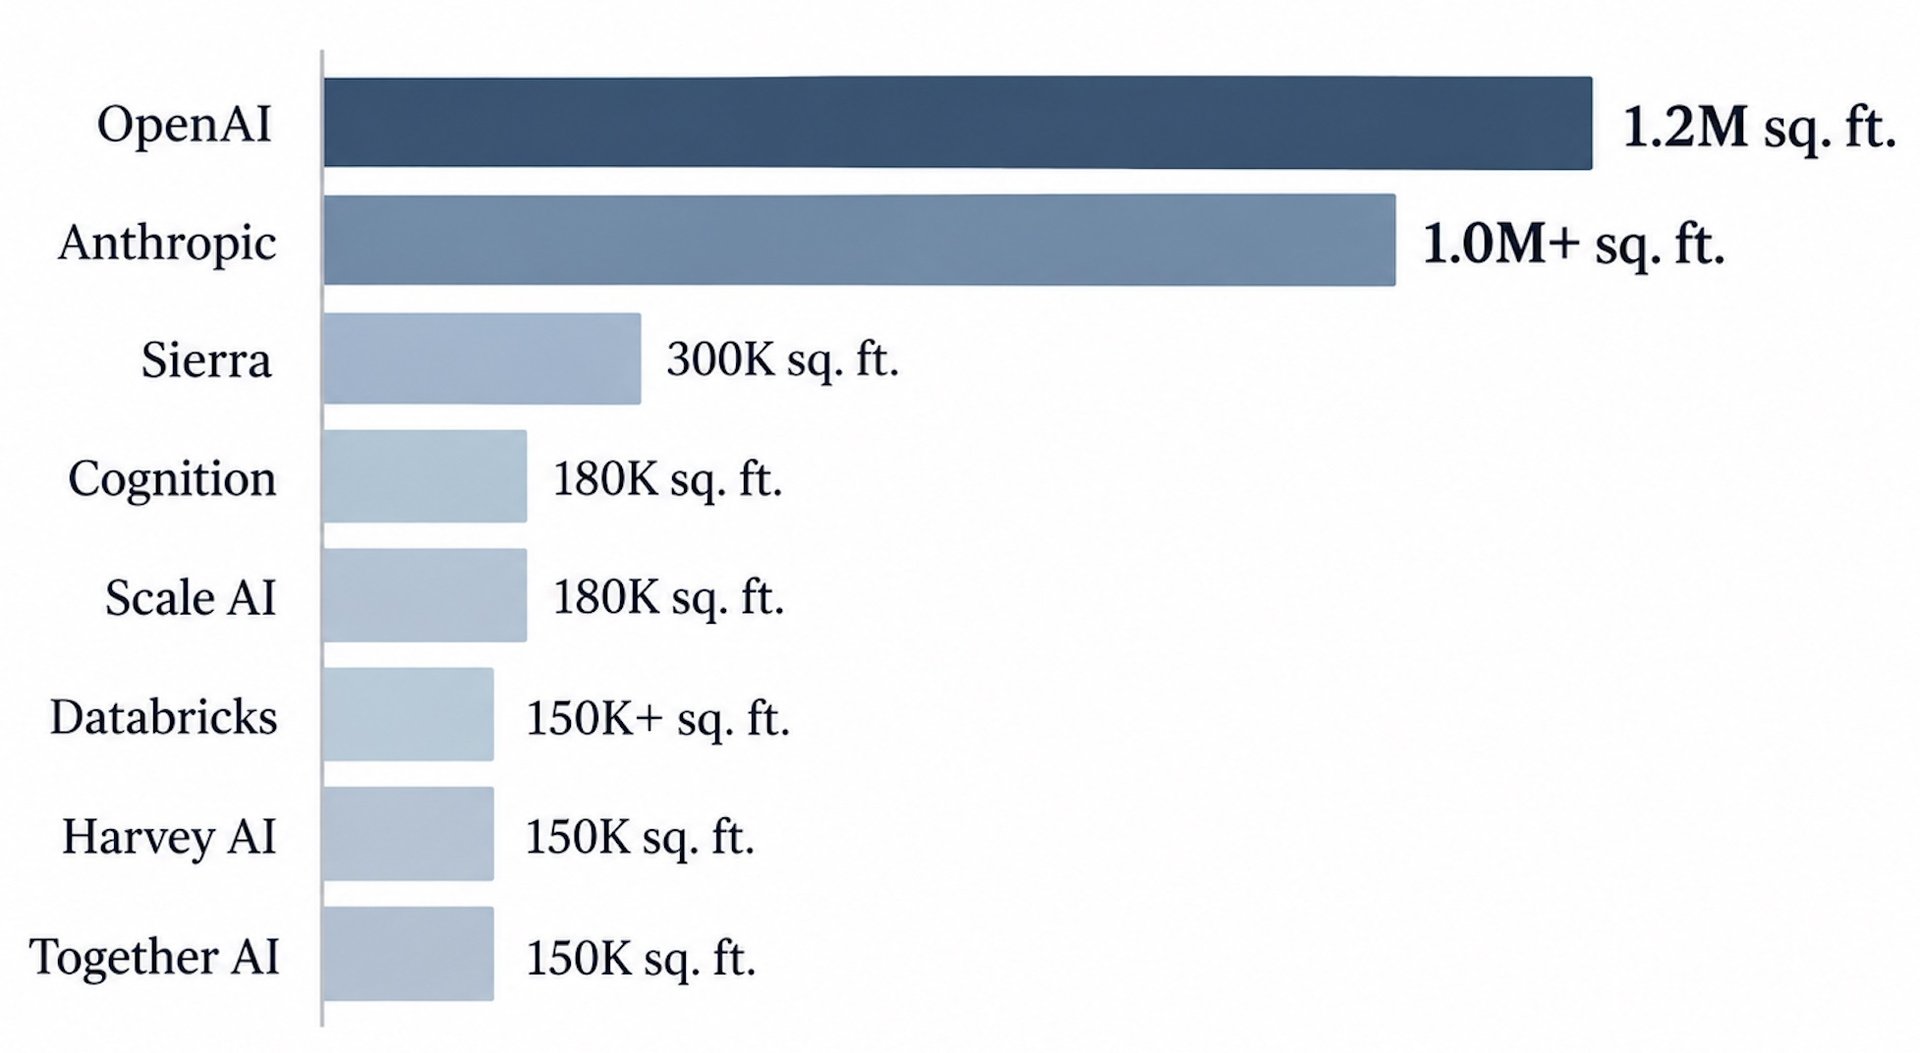
Here in San Francisco, there is a little more caution creeping into the AI story. OpenAI has reportedly pushed its IPO plans out, and investors are asking harder questions about the risks of moving too quickly. Recent warnings from leaders at OpenAI and Anthropic have added to that conversation. Yet, on the ground in San Francisco, AI companies are still making very large, very real commitments. OpenAI now occupies more than 1 million square feet of office space in Mission Bay, while Anthropic has continued expanding its South of Market footprint with several major leases (see the chart below). In other words, there may be more scrutiny around the AI boom, but these companies are still betting heavily on San Francisco.
At the same time, the Federal Reserve just raised its benchmark interest rate by 0.25 percentage point, bringing the target range to 3.75% to 4%, as policymakers respond to inflation that remains above their 2% goal. The Fed also signaled that additional tightening could be ahead. That matters for housing because borrowing costs were already moving higher. Nationally, mortgage rates reached nearly 7% this month, inventory climbed to a cycle high, sales softened and median prices have now declined for two consecutive months.
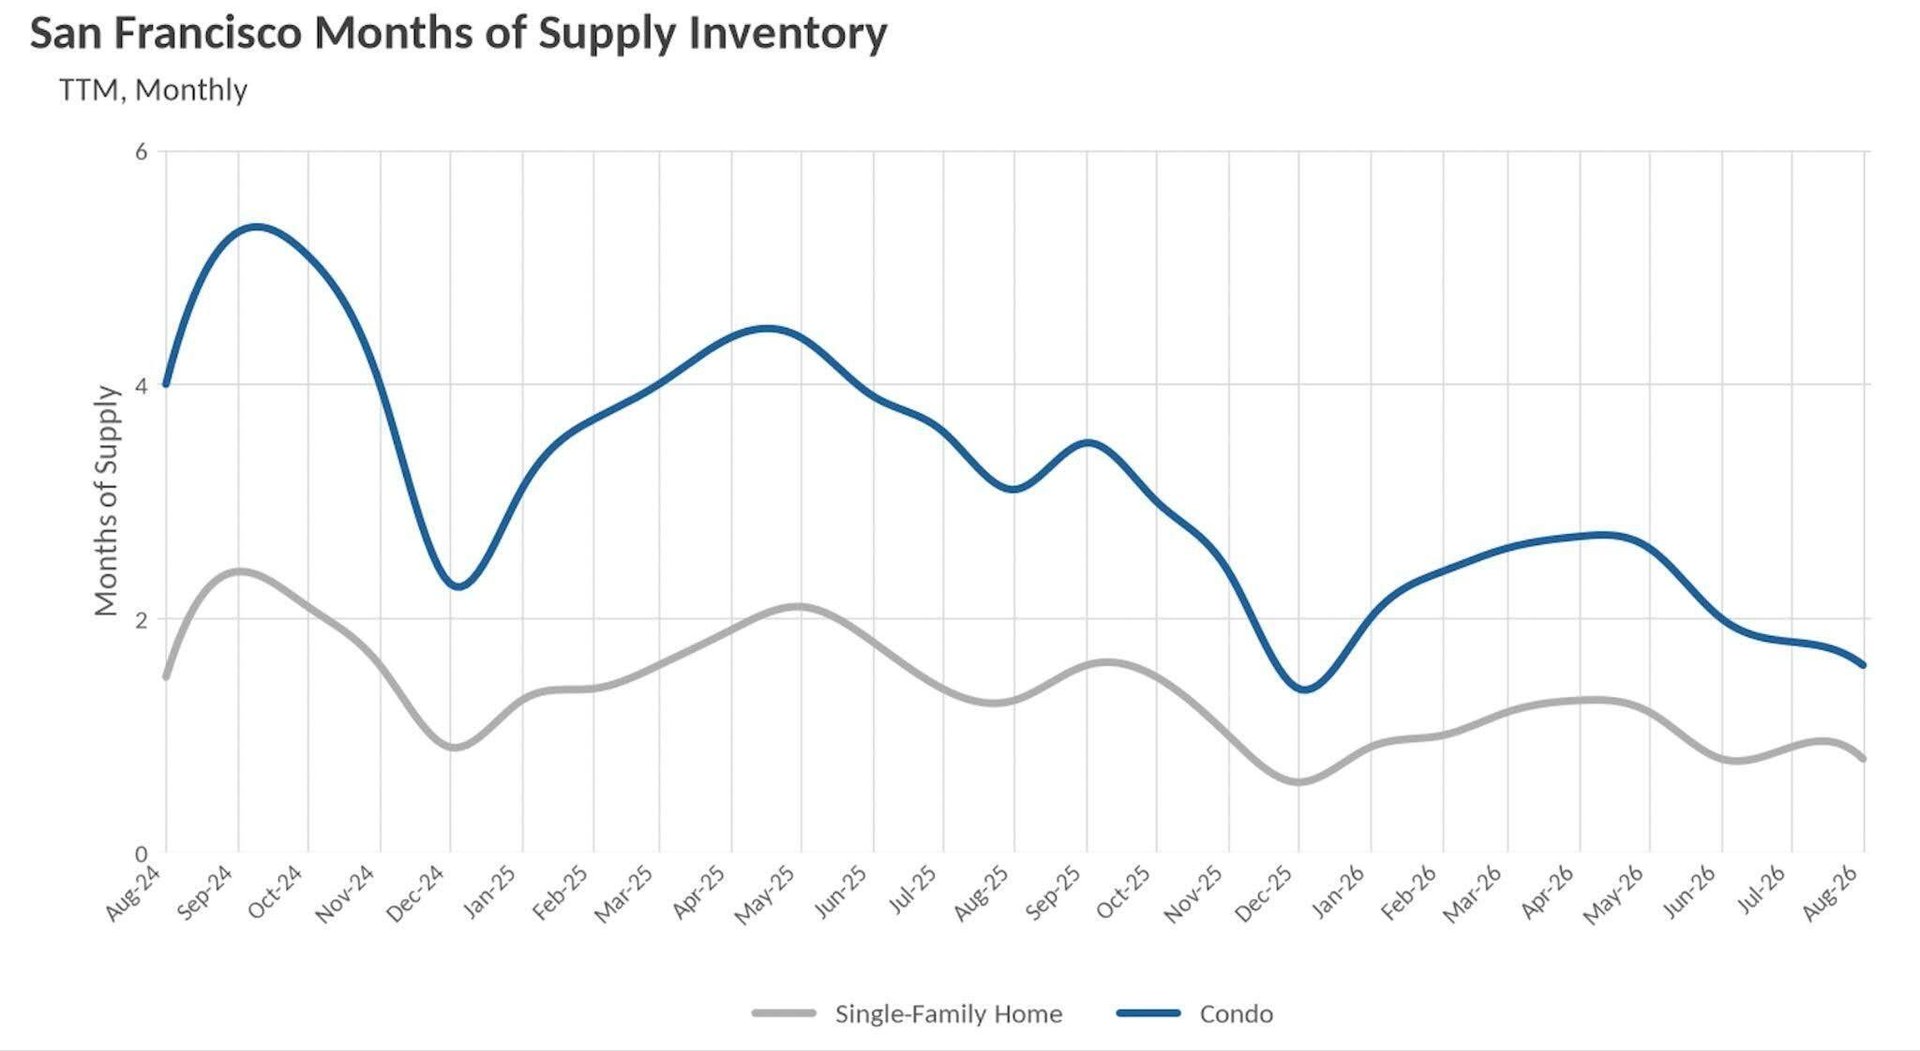
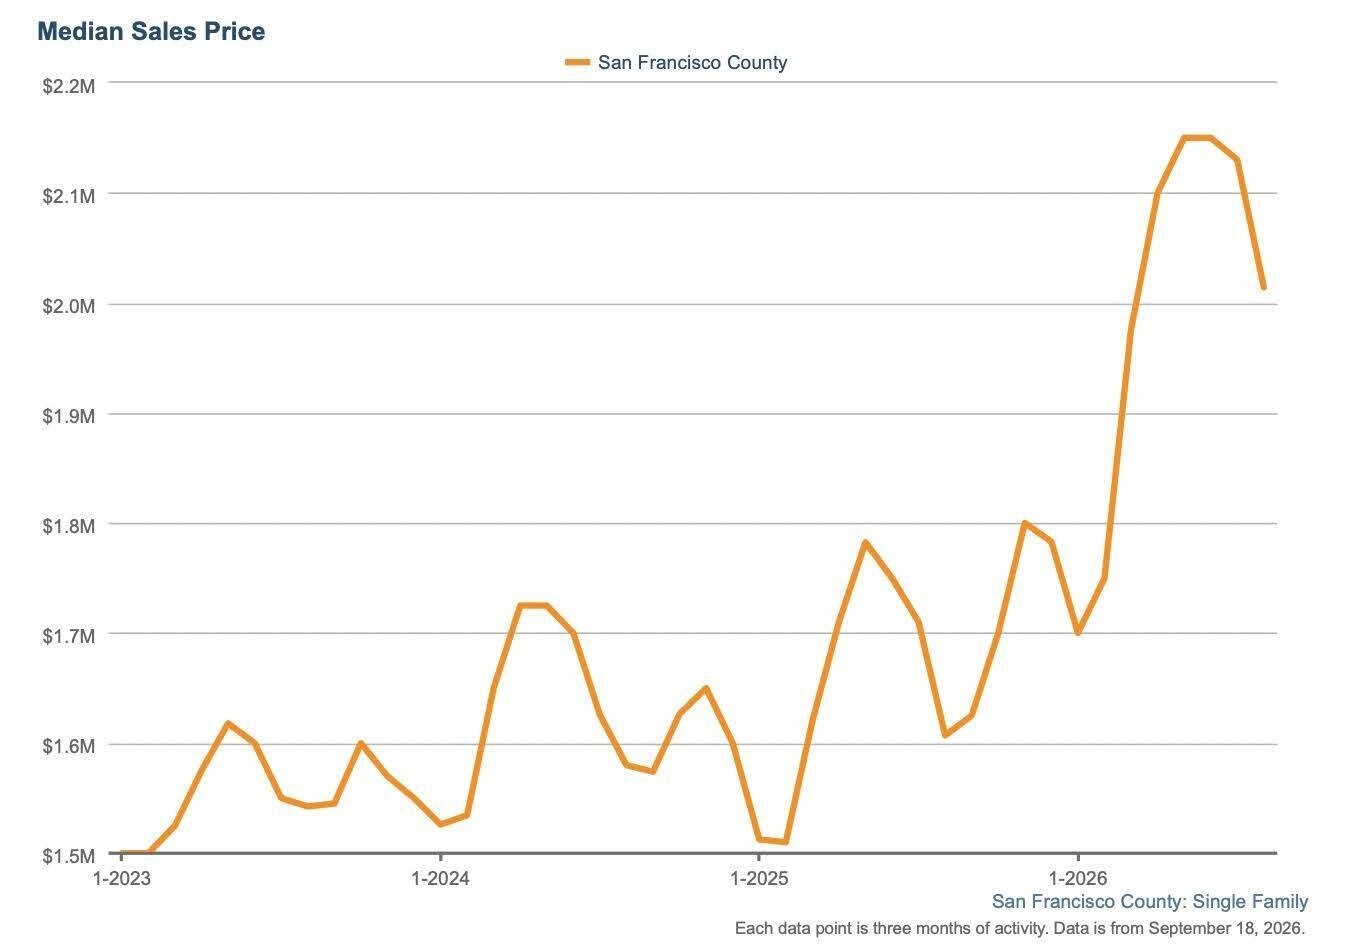
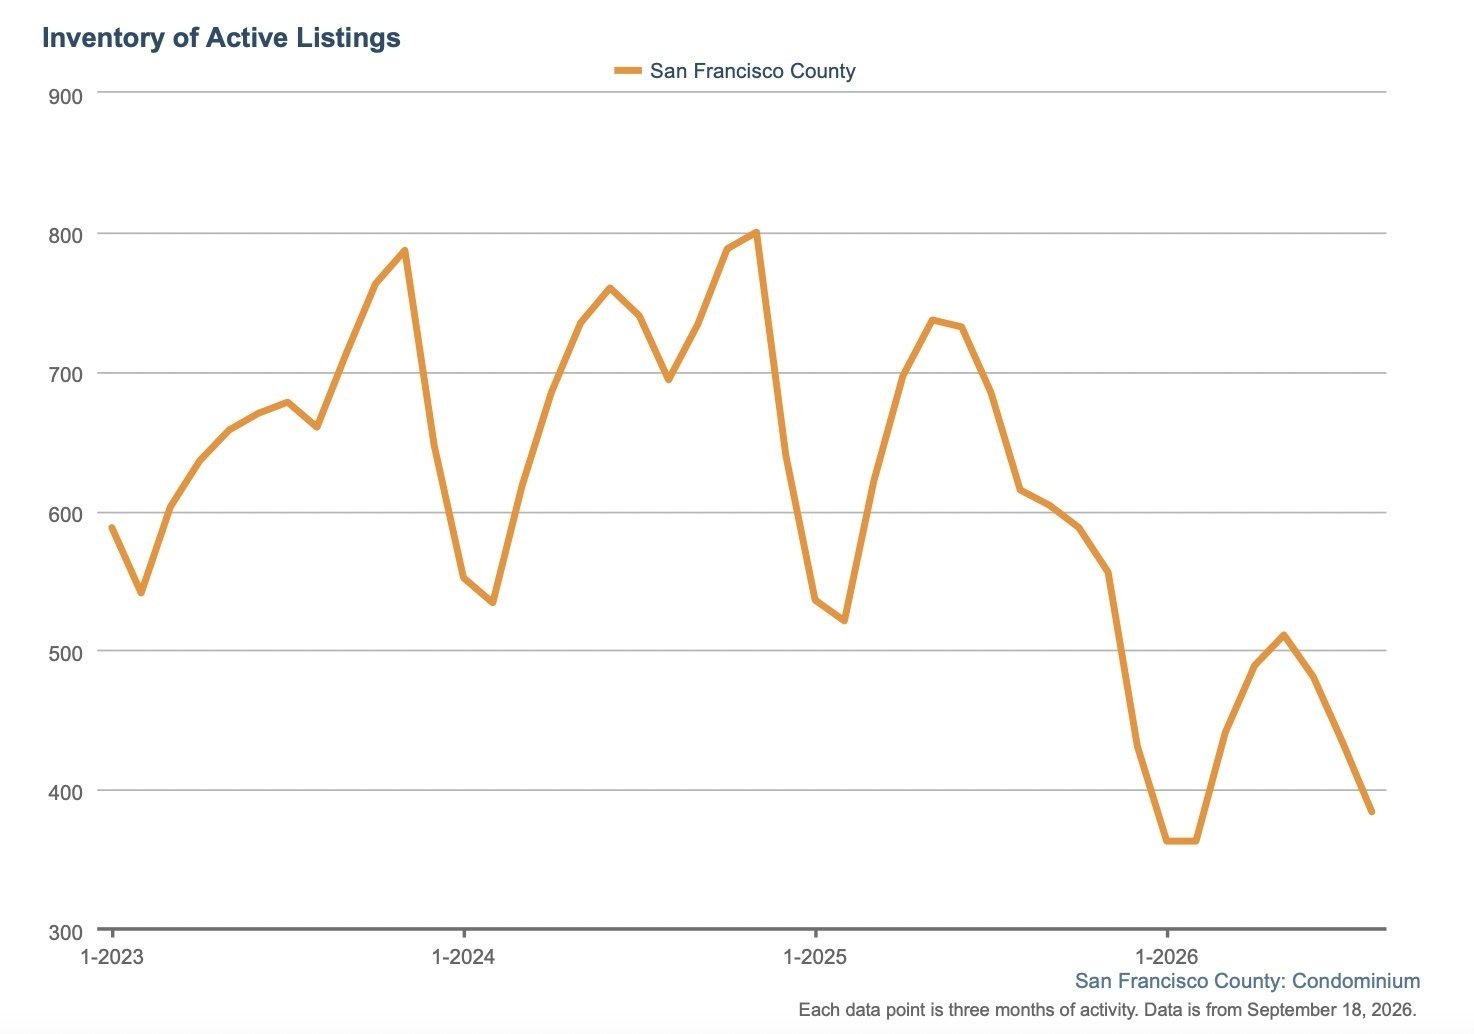
San Francisco, however, continues to look remarkably different from the national picture. August single-family prices were up more than 23% from a year earlier, while inventory was down roughly 33%. Condo inventory fell more than 36%, and condos that took an average of 51 days to sell last August were moving in just 19 days this August. Single-family homes averaged just 13 days on market, and the city's months of supply remained extremely tight at 0.8 months for houses and 1.6 months for condos. So while the national market is giving buyers more choices and more negotiating room, San Francisco continues to be defined by limited supply and strong demand.
One final development worth watching, particularly for condo owners and buyers: financing standards for condominium projects are changing. As of August 3, Fannie Mae tightened how lenders evaluate reserve studies. Beginning January 4, 2027, projects undergoing a full review will generally need to budget at least 15% of annual assessment income for replacement reserves, up from 10%. That means an HOA's reserves, insurance, deferred maintenance and financial health are becoming an even more important part of whether a buyer can obtain conventional financing.
It is a complicated backdrop: higher rates, more questions around AI, a cooler national housing market and, at the same time, a San Francisco market that continues to operate by its own rules. That's exactly why we keep digging into the data.
Mortgage Rates Tick Back Up
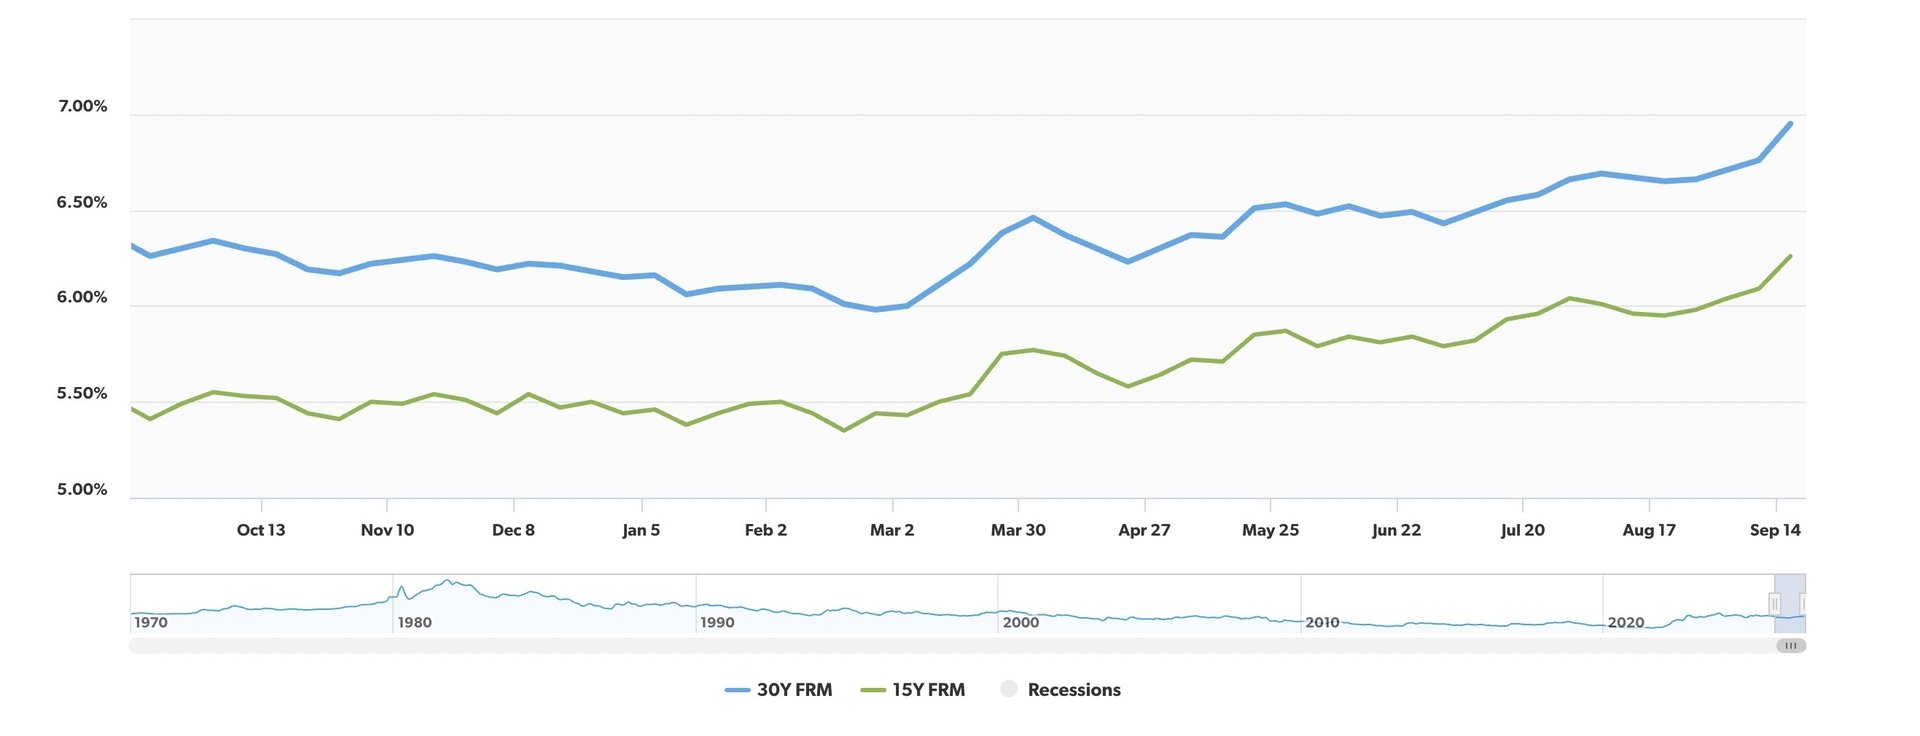
Mortgage rates moved higher this week as financial markets continue to react to incoming economic data. As of September 17, the average 30-year fixed mortgage rate is 6.95%, up from 6.76% last week and 6.26% one year ago. The 15-year fixed rate now averages 6.26%, compared with 6.09% last week and 5.41% at this time last year. For buyers, rates remain an important part of the affordability equation, but in competitive markets like San Francisco, we're continuing to see buyers weigh the cost of financing against limited inventory and the opportunity to secure the right home. (Freddie Mac)
Where Are Mortgage Rates Headed Next?
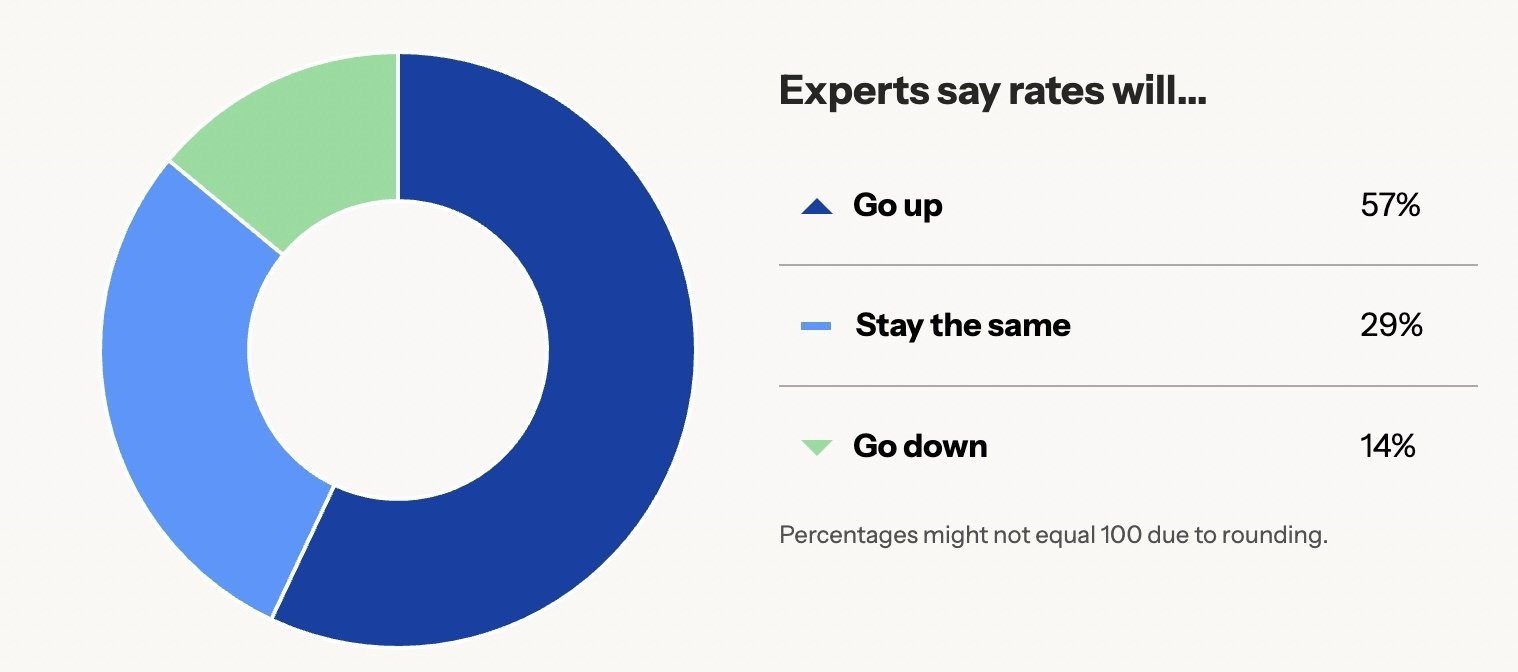
Most rate experts are expecting mortgage rates to move higher in the coming weeks. According to Bankrate’s latest poll, 57% predict rates will rise, while 29% expect them to hold steady and just 14% anticipate a decline. As of September 16, Bankrate’s average 30-year fixed mortgage rate was 6.97%. For buyers, even small rate movements can have a meaningful impact on monthly payments and purchasing power. (Bankrate)
Oil Prices Are Climbing Again
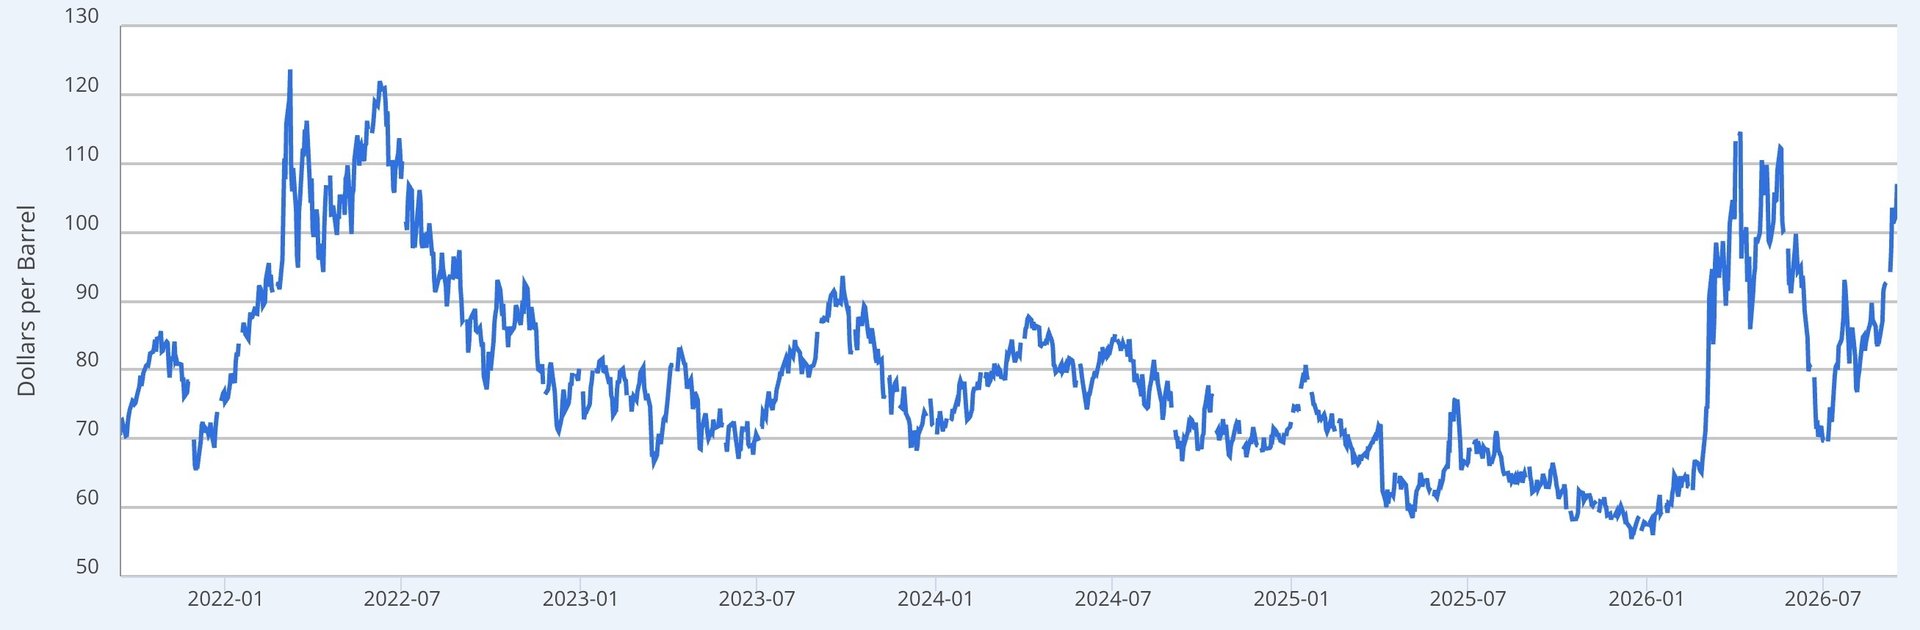
Crude oil prices have moved sharply higher in recent weeks. As of September 15, oil was trading at $107.02 per barrel, up from $83.99 just one month earlier and well above the mid-summer low of $69.73. That’s a jump of roughly 27% in one month and more than 53% from the summer low, putting renewed pressure on energy costs and potentially adding another inflationary wrinkle to the broader economic outlook. (FRED)
Gas Prices Are Rising Along With Oil
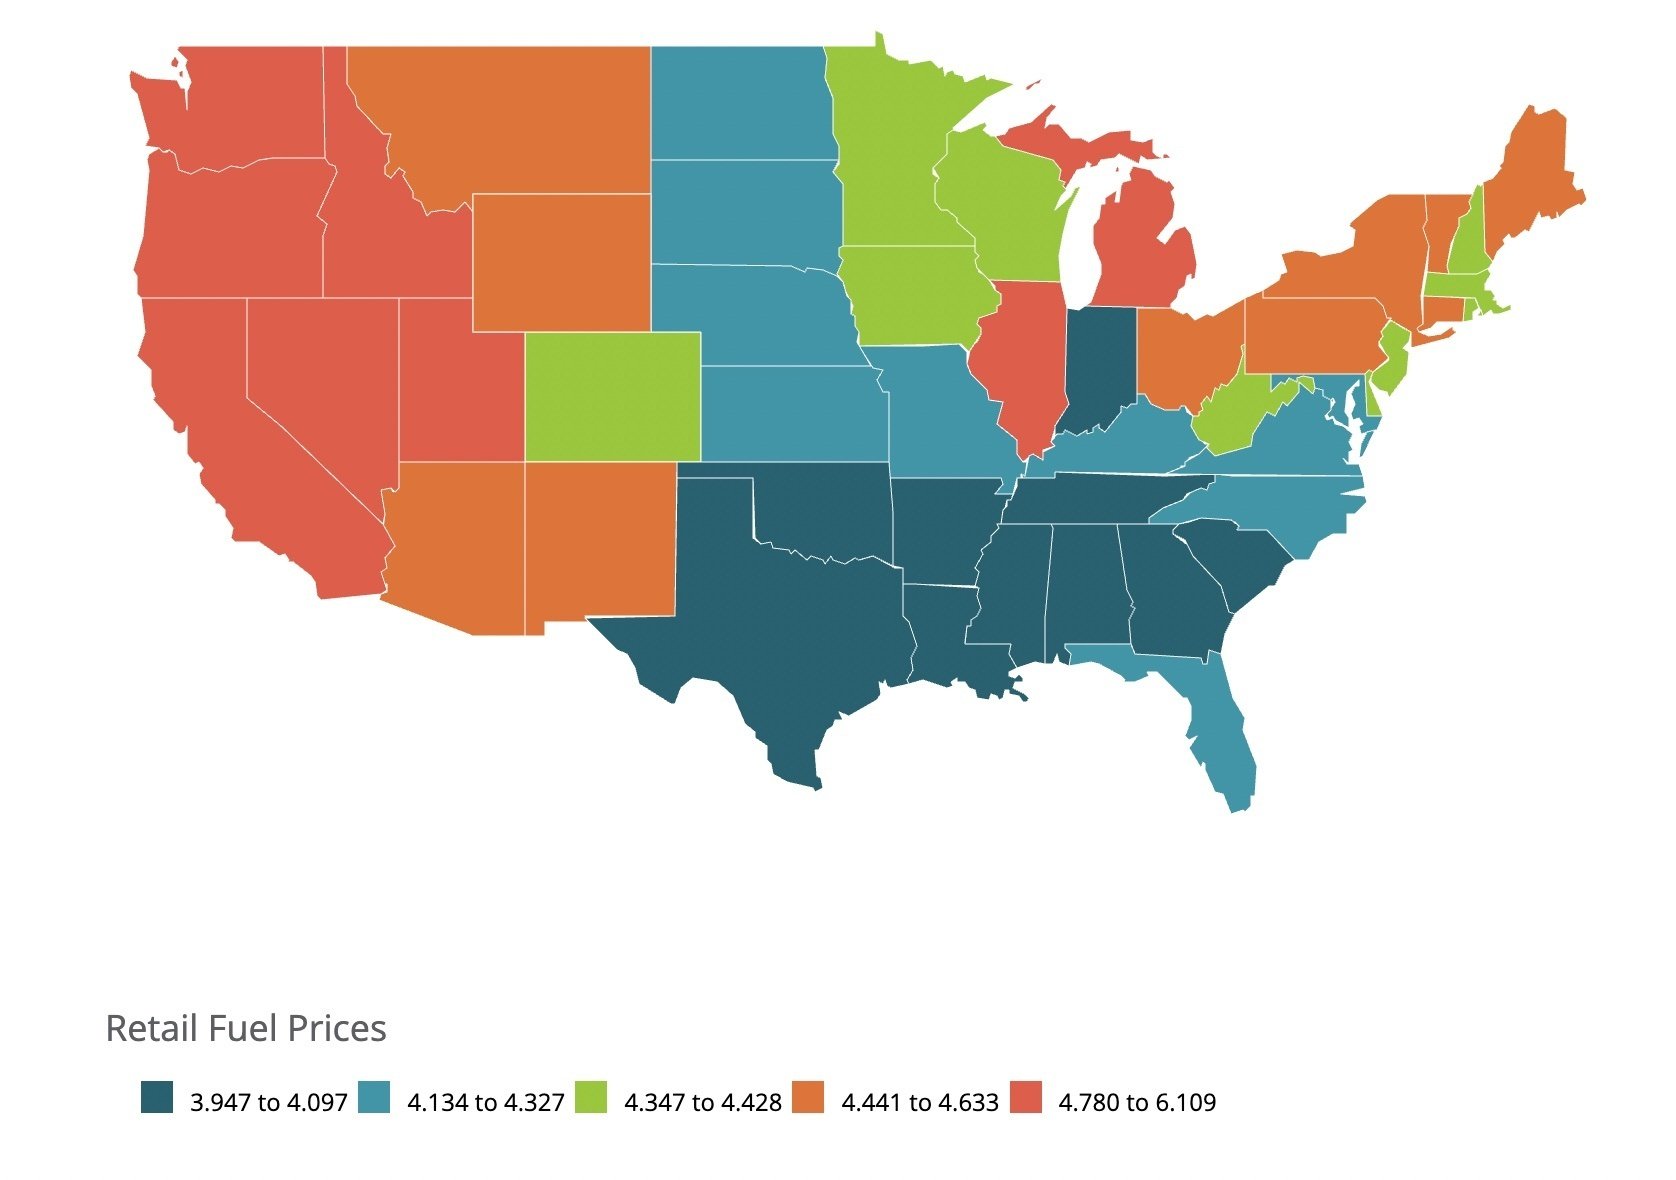
Higher crude oil prices are showing up at the pump. As of September 18, the national average for regular gasoline was about $4.47 per gallon, up 17 cents in just one week, nearly 40 cents from a month ago, and roughly $1.27 from a year earlier. California remains considerably more expensive than the national average, with prices still hovering in the mid-$5 range. For consumers, that means another hit to household budgets, and another inflation pressure point to watch heading into fall. (GasBuddy)
Inflation Holds at 3.4%
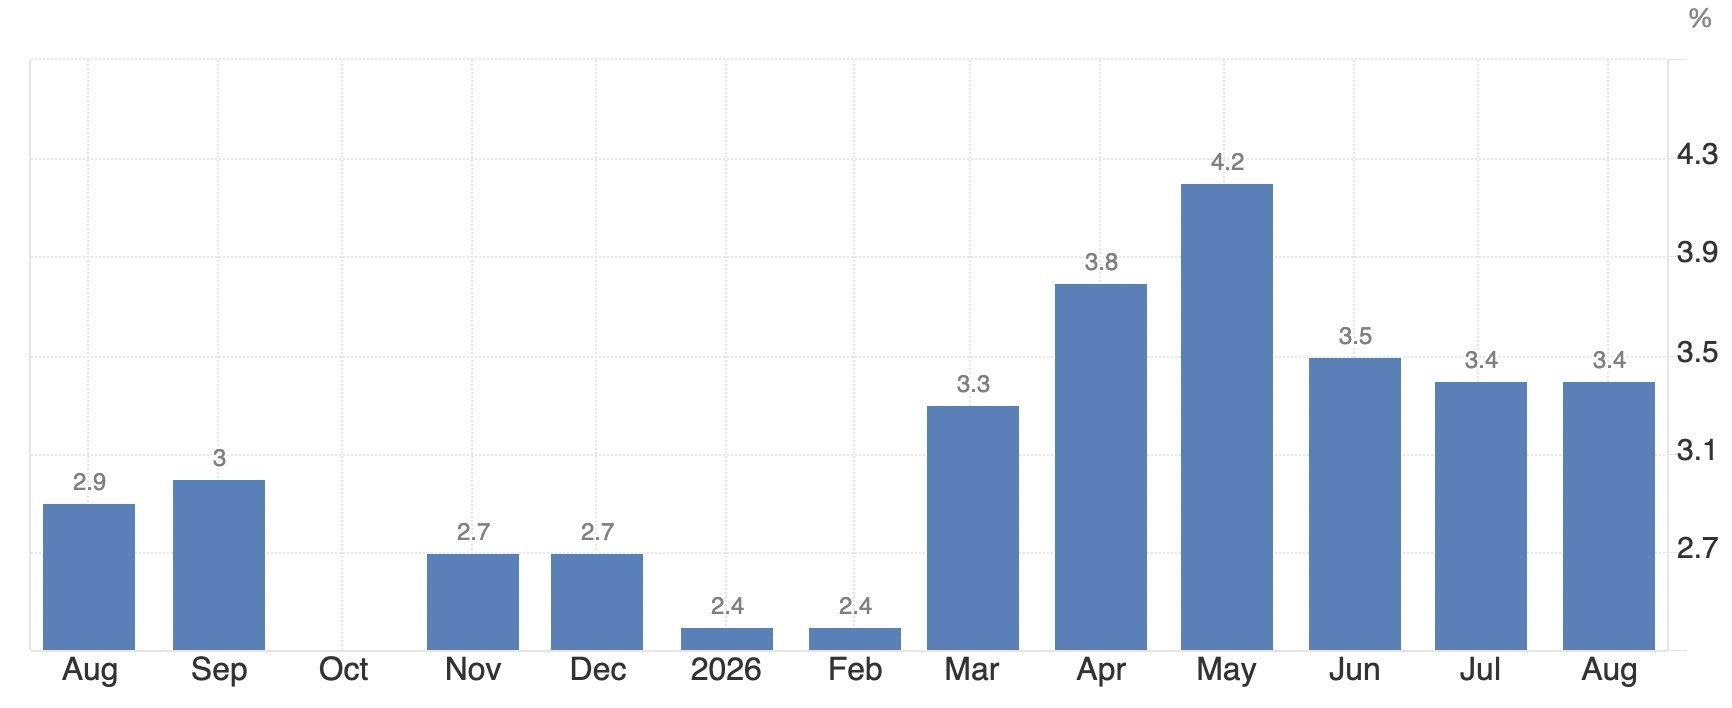
U.S. inflation held steady at 3.4% in August, the same as July. Higher energy costs were the biggest driver, with gasoline prices up 27.4% from a year ago. At the same time, shelter and food inflation both eased, and core inflation slowed to 2.4%, its lowest level since early 2021. Energy prices remain the biggest wild card heading into fall. (Bureau of Labor Statistics)
The Economy Is Looking Increasingly K-Shaped
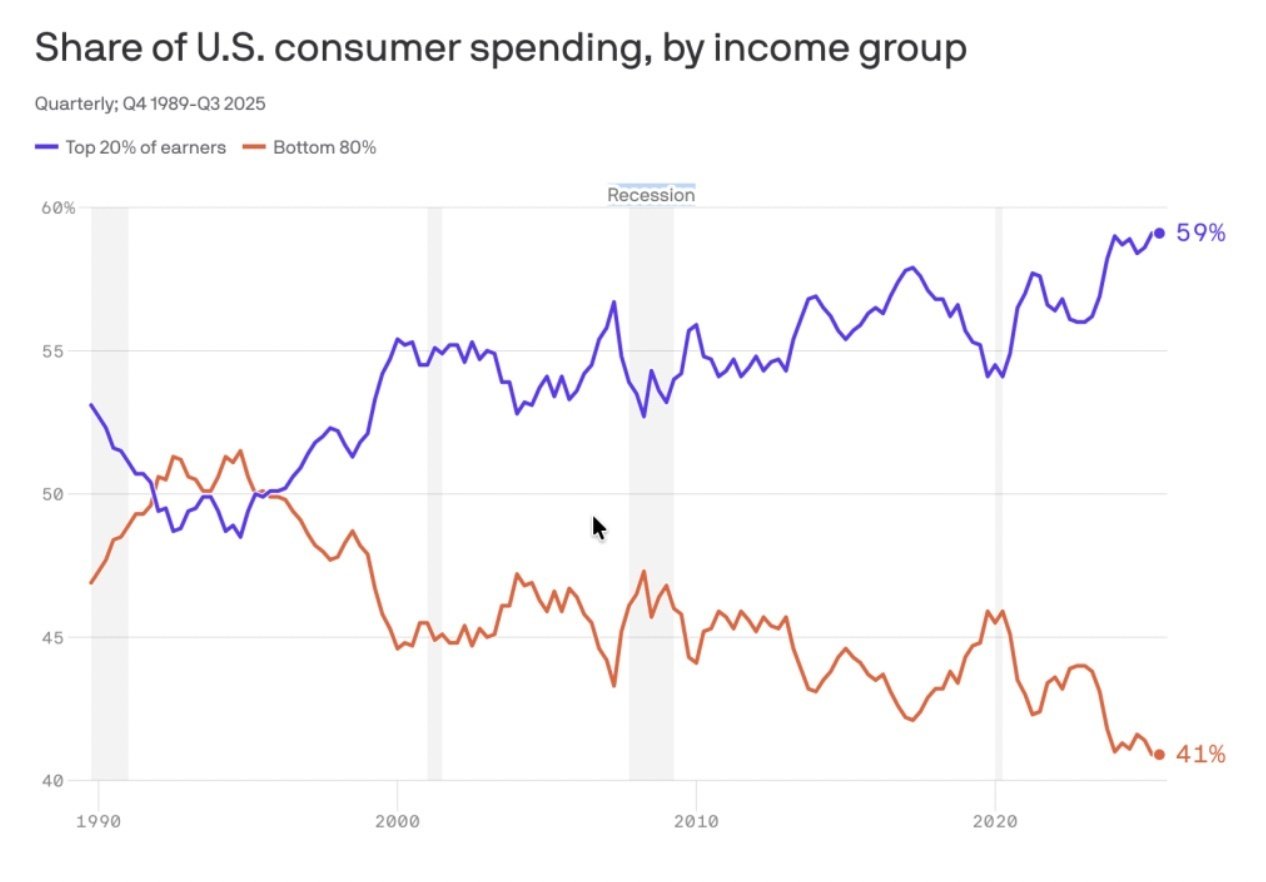
Higher-income households continue to spend and benefit from rising asset values, while many lower- and middle-income households are feeling more pressure from inflation and higher everyday costs. Research confirms that recent consumer spending growth has been driven disproportionately by higher-income households. In simple terms: the top end of the economy is doing well, while a large portion of consumers is struggling to keep pace. (Moody’s, University of Michigan, California Association of Realtors)
Consumer Debt Continued to Rise in Q2
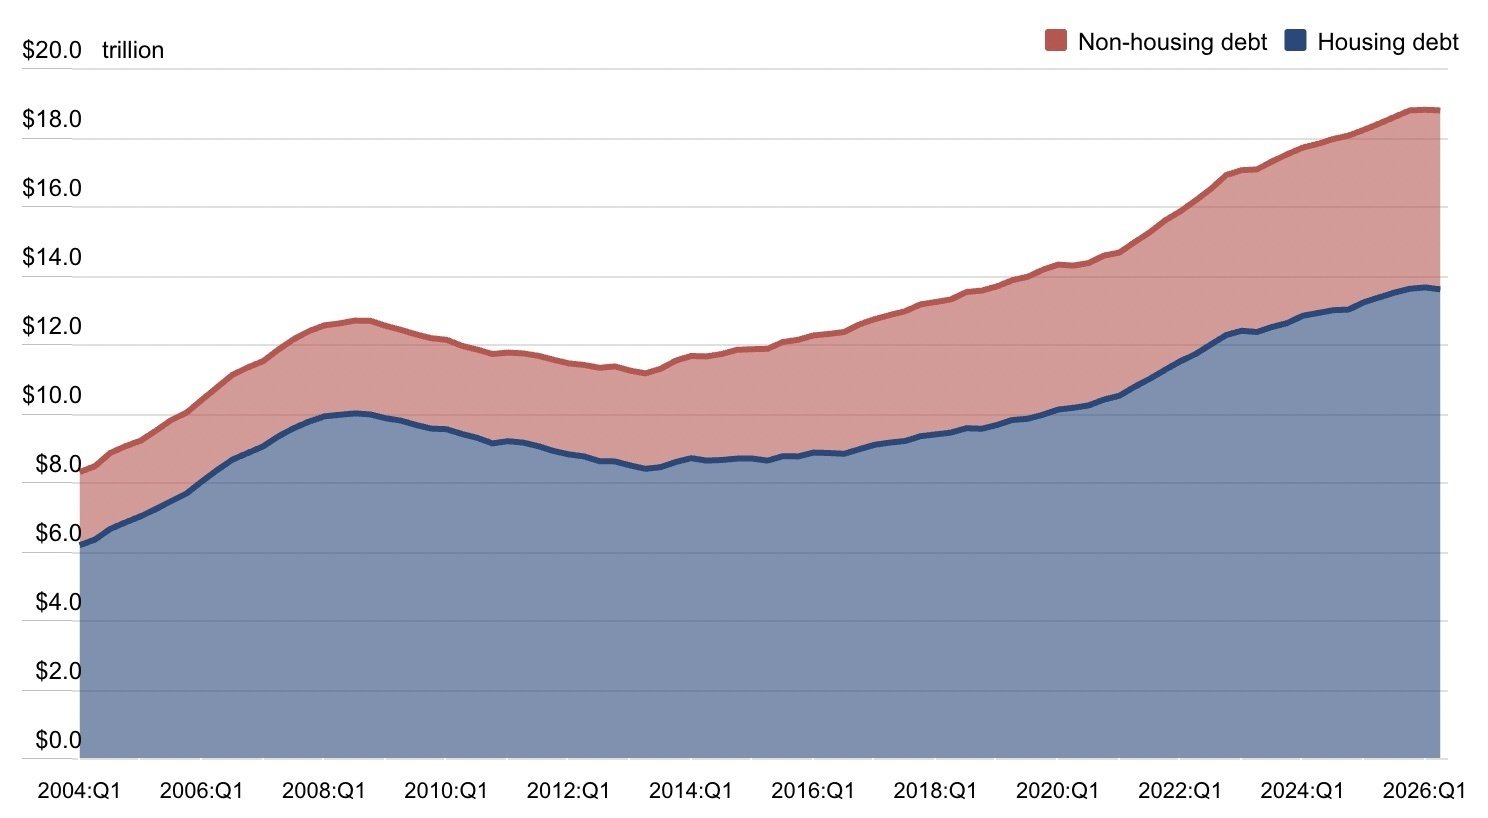
Mortgage balances fell by $74 billion in the second quarter, bringing the total to $13.1 trillion. That decline was largely technical, caused by a temporary reporting gap tied to a mortgage servicing transfer. Meanwhile, home equity lines of credit balances rose for the 17th straight quarter, increasing by $13 billion to $459 billion. Credit card balances were up $21 billion, auto loans rose $28 billion, and other consumer debt also edged higher. Student loan balances dipped slightly. Overall, consumers are continuing to take on more non-mortgage debt, particularly through credit cards, auto loans and home equity lines. (Federal Reserve Bank of New York)
The National Data
National Housing Market Heads Into Fall With More Choices, More Equity and a Growing Split by Price Point
Nationally, the fall housing market is showing a few important shifts. Buyers are seeing more inventory, more time to make decisions and, in many markets, more price reductions than they faced earlier in the year. At the same time, homeowners continue to hold substantial equity, averaging about $310,500, giving many sellers and would-be movers more financial flexibility. The market is also becoming increasingly divided by price point, with luxury sales holding up more strongly while entry-level homes are more likely to see longer days on market and price adjustments. The takeaway: this is not one uniform national market, and both buyers and sellers need to look closely at what is happening in their specific price range and location. (Keeping Current Matters)
Fall Typically Brings a Seasonal Price Shift
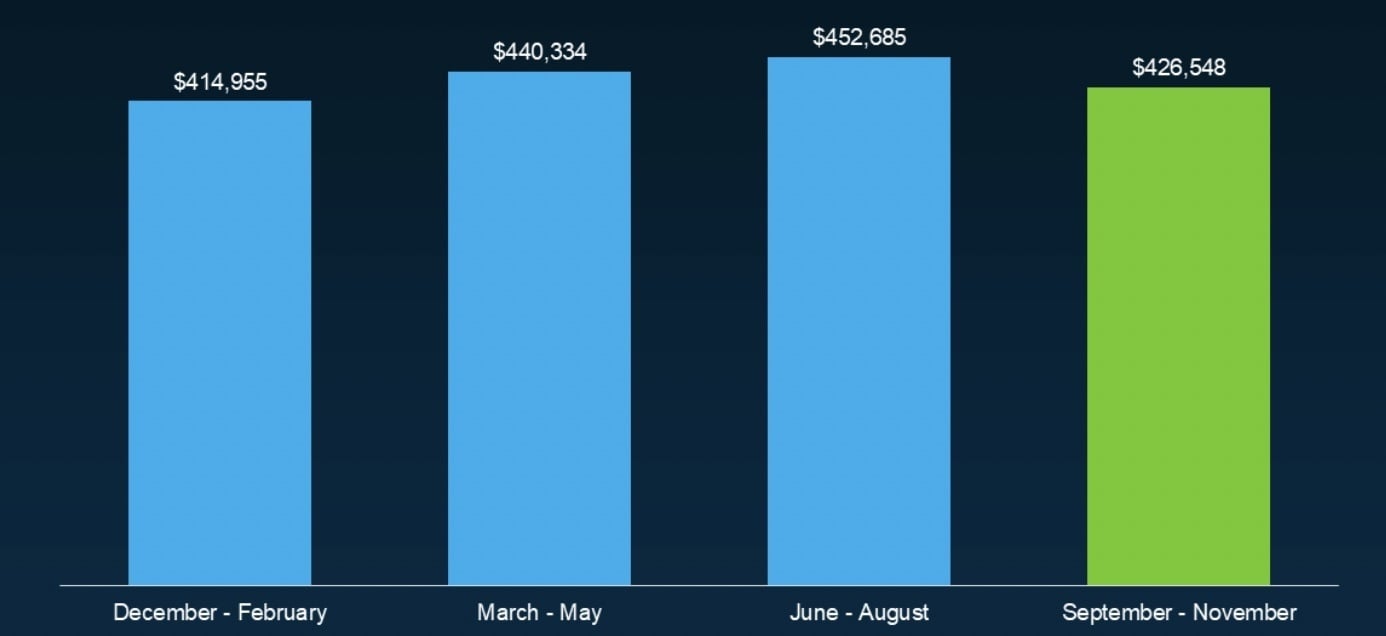
Nationally, home prices tend to peak during the summer and soften as the market moves into fall. Looking at median list prices from 2022–2026, the average rises from about $415,000 in winter to nearly $453,000 in summer, before easing to roughly $427,000 from September through November. For buyers, fall can bring a little more negotiating room. For sellers, it’s a reminder that pricing correctly becomes even more important as the seasonal market changes. (Housing Wire)
Homeowner Equity Is Growing Again
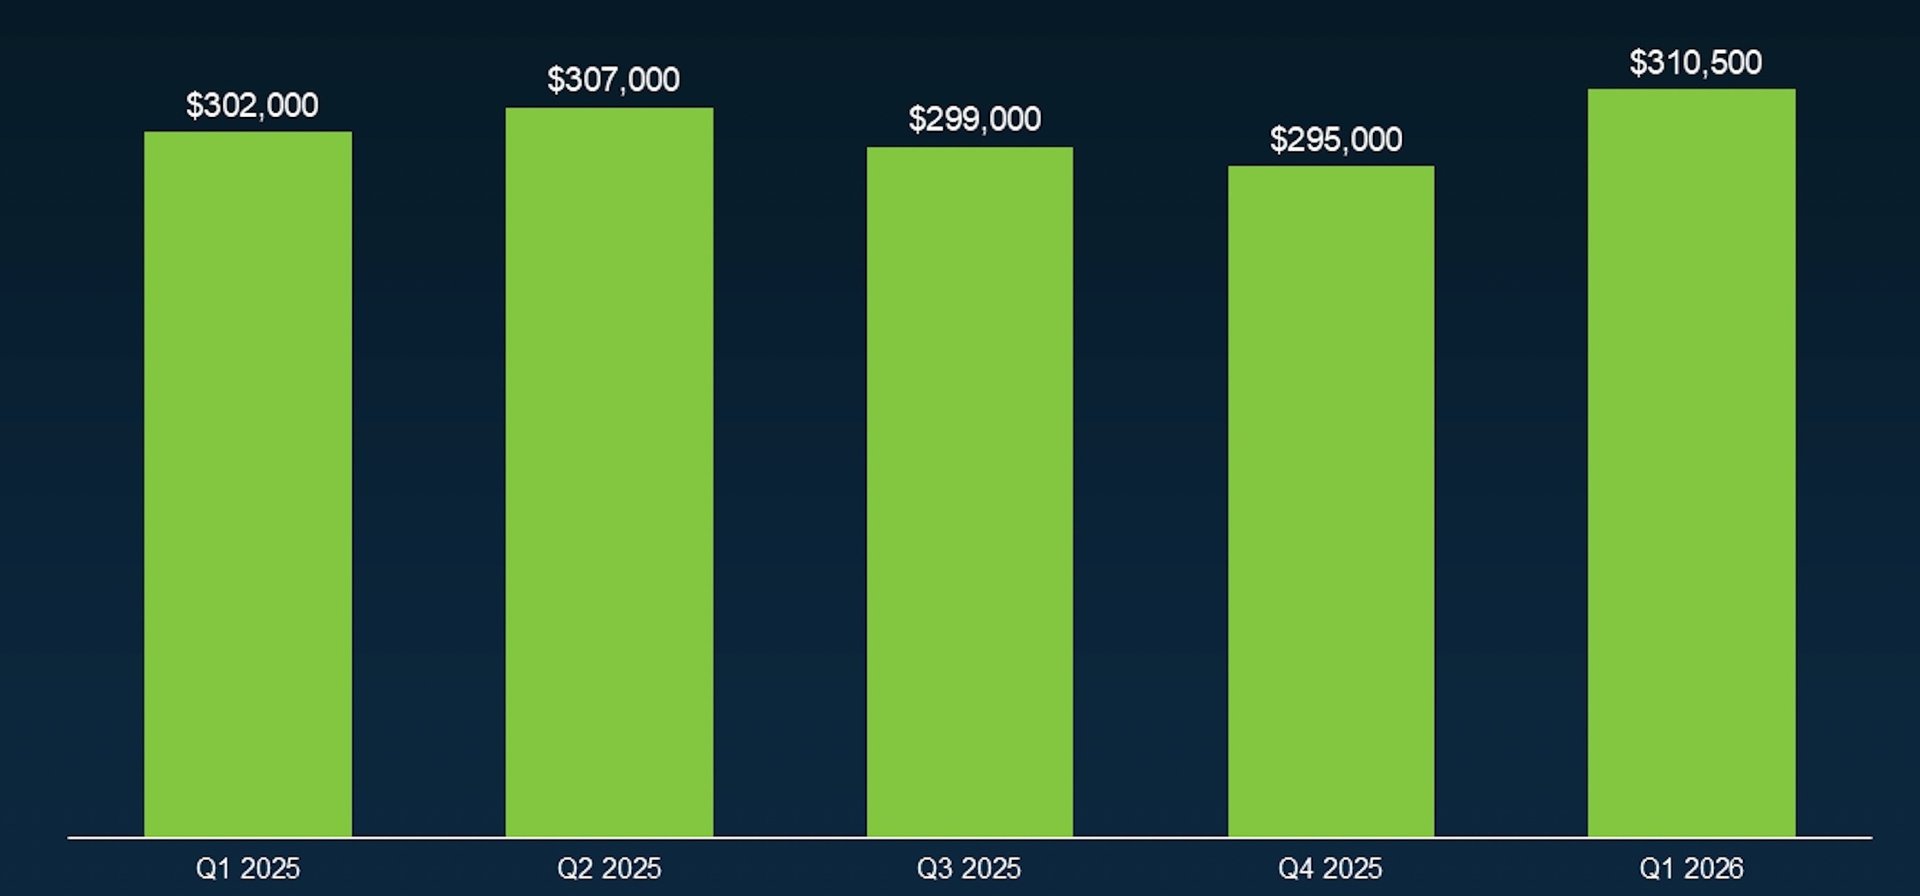
After dipping in the second half of 2025, homeowner equity rebounded to a new high in early 2026. The average homeowner now has about $310,500 in equity, up from $295,000 at the end of last year. That strong equity position gives many homeowners more flexibility, whether they’re considering a move, tapping equity for another purchase, or simply benefiting from the long-term gains in homeownership. (Cotality)
Homeowners Are Sitting on Record Levels of Equity, Especially in California
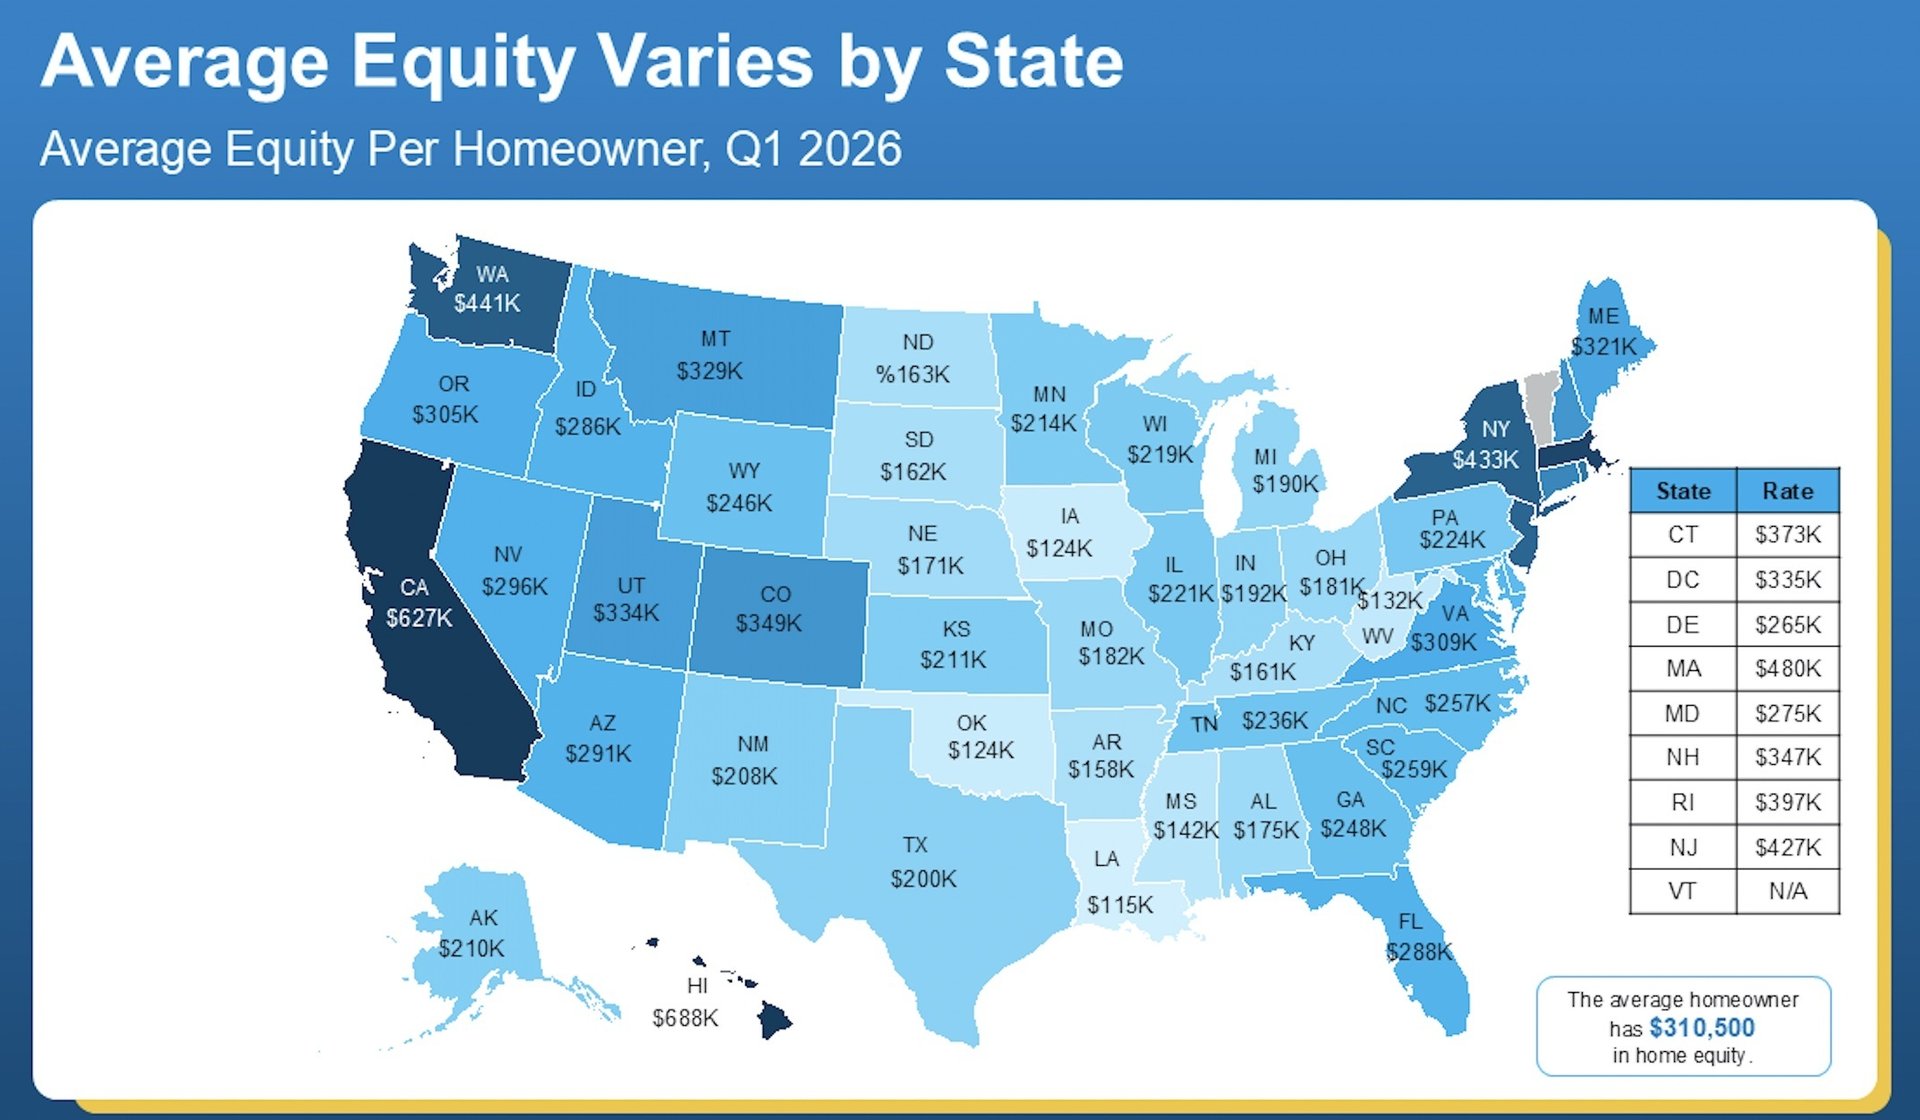
Homeowners across the country are sitting on significant wealth in their homes, but the numbers vary dramatically by state. As of Q1 2026, the average U.S. homeowner had $310,500 in home equity. California stands out at roughly $627,000 per homeowner, about twice the national average, with Hawaii even higher at approximately $688,000. That equity can give longtime owners meaningful flexibility, whether they are considering a move, downsizing, investing or simply reassessing what is possible in today’s market. (Cotality)
The National Housing Market is Splitting in Two
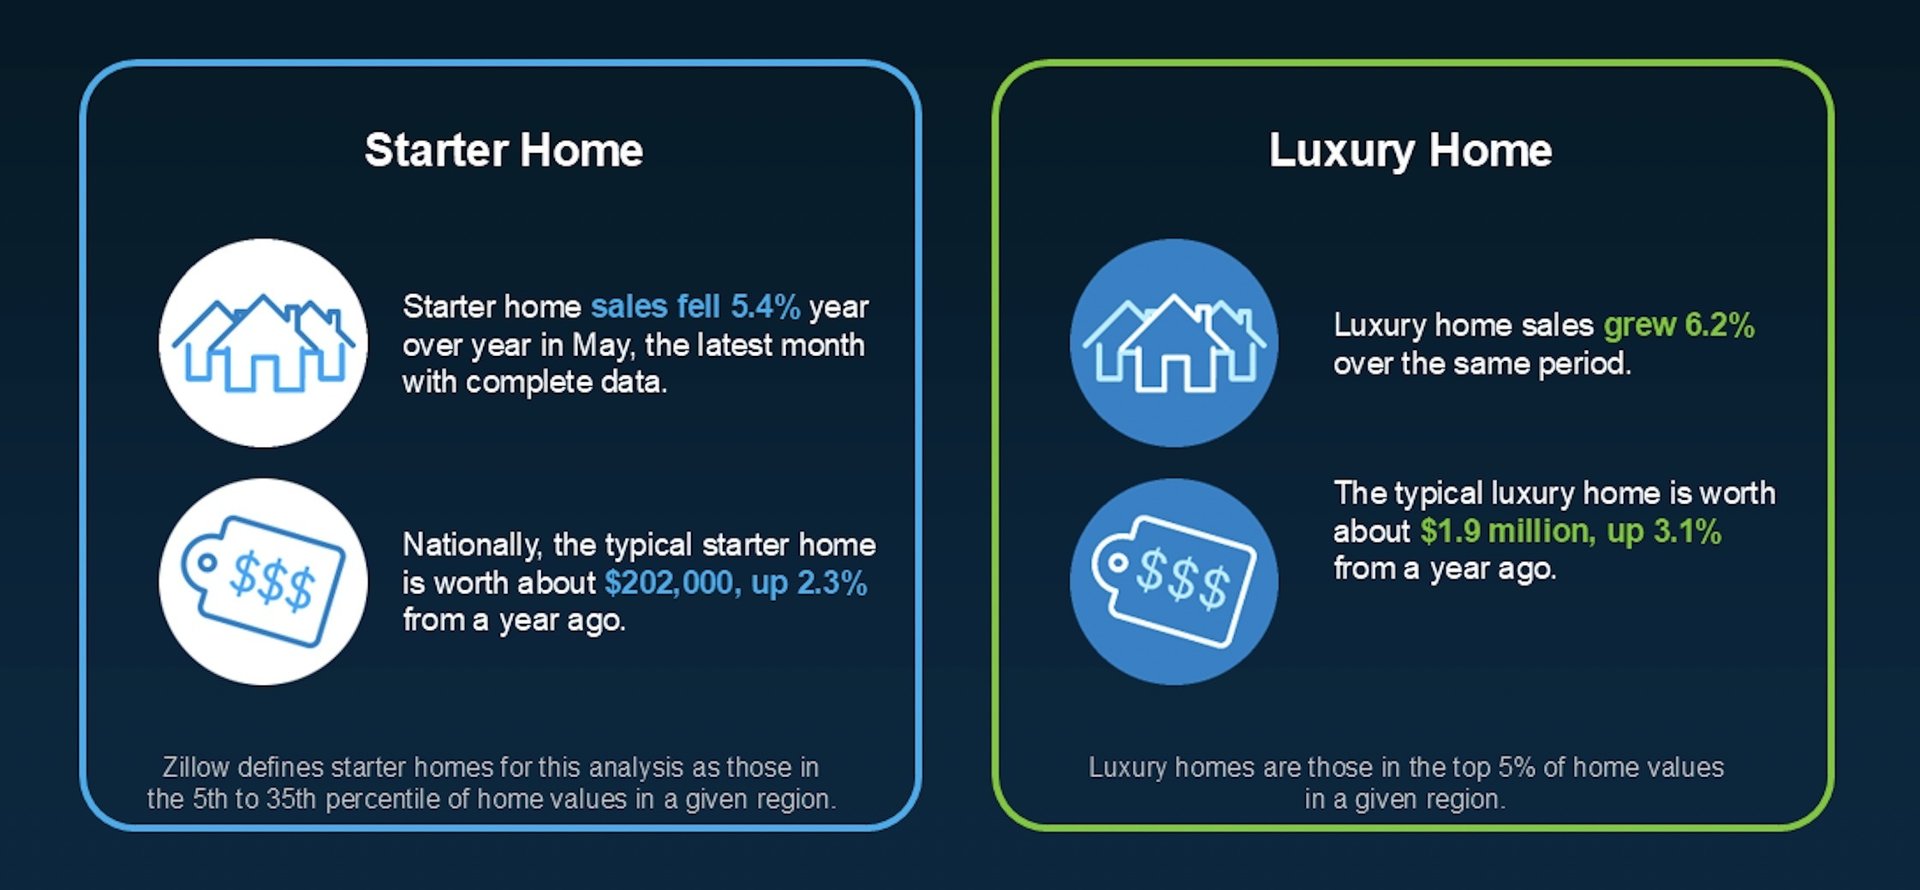
The national housing market is increasingly telling two different stories depending on price point. In May, starter-home sales fell 5.4% year over year, even as values edged up 2.3% to about $202,000. At the luxury end, sales rose 6.2%, while typical values climbed 3.1% to roughly $1.9 million. Higher-end buyers continue to show more resilience, while affordability pressures are weighing more heavily on entry-level buyers. (Zillow)
Local Data
San Francisco’s housing market remains remarkably competitive heading into fall. Single-family home prices are still running more than 23% above last year, even as the median price has eased for three consecutive months from its spring peak.
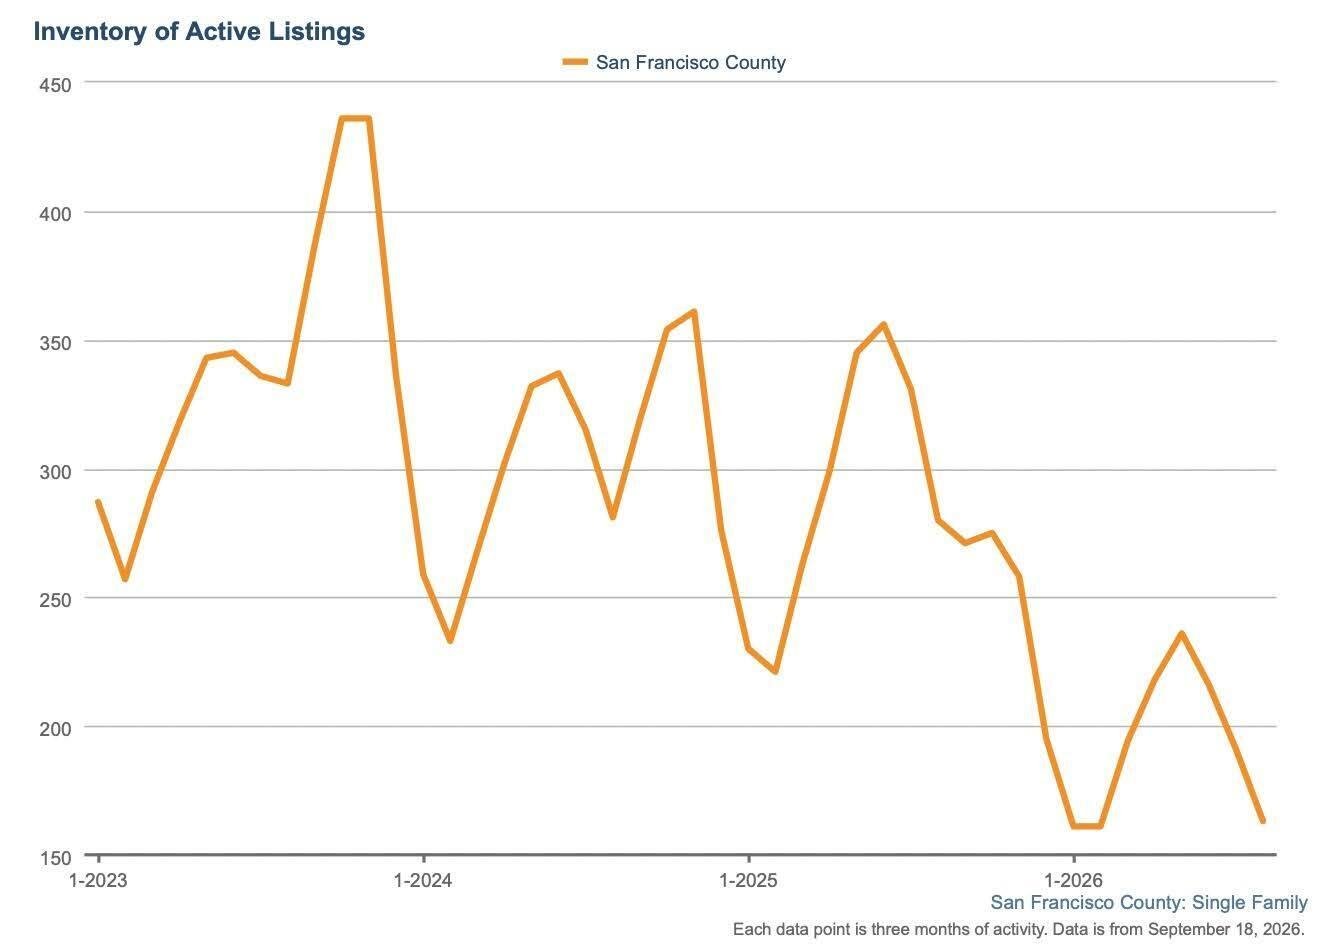
At the same time, inventory continues to shrink, with both single-family and condo listings down sharply from a year ago. Homes are also moving quickly: single-family properties are selling in just 13 days, while condos have sped up dramatically to 19 days, compared with 51 days last August.
In short, prices may have cooled slightly from their spring highs, but low inventory and faster sales continue to keep pressure on the San Francisco market.
AI Is Moving In, and That Matters for Housing
Even amid questions around AI valuations, IPO timing and the broader economy, AI companies continue to make a very tangible bet on San Francisco. OpenAI and Anthropic now each occupy roughly 1 million square feet or more of office space, with a growing roster of AI firms expanding behind them. For the housing market, the important story isn’t just the office recovery. It’s the people, jobs and spending power those leases bring back into the city. (Office leases in San Francisco, based on 2026 reporting, SF Standard, SF Chronicle, The Real Deal)
SF Home Prices Ease from Record Highs, but Remain Far Above Last Year
San Francisco’s median single-family home price was $2.014 million in August, down from the $2.15 million peak reached in May and June, but still roughly 25% higher than August 2025, when the median was $1.607 million. The broader trend is striking: after hovering largely in the $1.5 million to $1.8 million range over the past several years, single-family prices moved decisively above $2 million this spring. August’s decline looks more like a seasonal easing from an exceptionally strong spring market than a significant reversal in pricing. (SF MLS, InfoSparks)
SF Condo Prices Remain Well Above Last Year
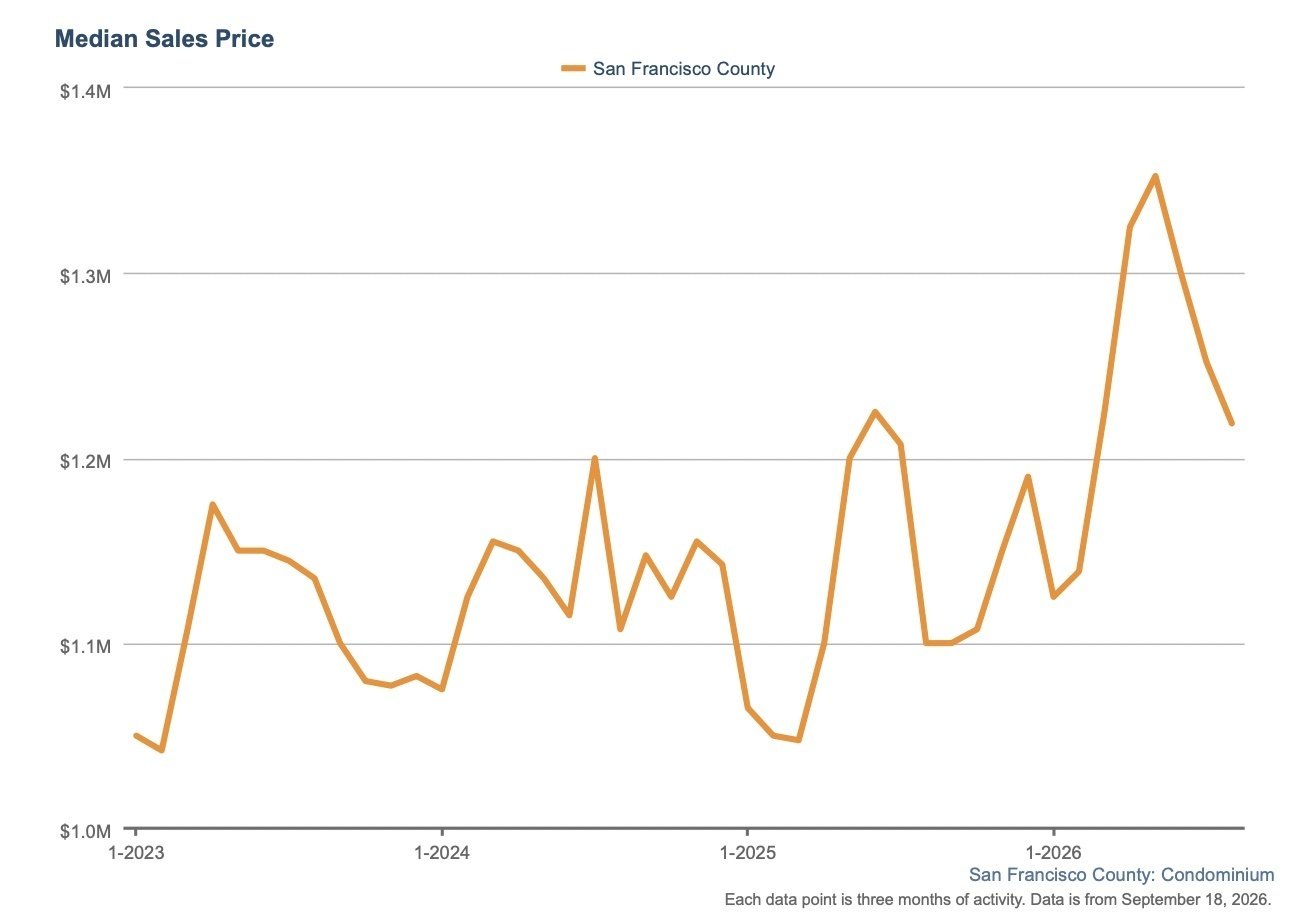
San Francisco’s median condo sales price was $1,218,750 in August, down from the $1,352,500 spring peak in May, but still about 11% higher than August 2025, when the median was $1.1 million. The longer view is even more telling: condo prices have been trending higher since early 2025, with this spring producing the strongest pricing of the past several years. (SF MLS, InfoSparks)
SF Home Inventory Remains Extremely Tight
San Francisco single-family home inventory remains low by recent historical standards, but supply is beginning to build again. As of September 18, active listings had risen to 213, a noticeable increase from the late-summer lows. That seasonal bump is important because fall is typically San Francisco’s second-busiest selling season, after spring. More homes tend to come to market after Labor Day, giving buyers additional choices while still keeping overall inventory relatively tight. (SF MLS, InfoSparks)
SF Condo Inventory Is Building, but Still Constrained
San Francisco condo inventory remains well below prior-year norms, but it too is starting to rise with the fall market. As of September 18, active condo listings stood at 423, up from the recent late-summer low. That increase fits the usual seasonal pattern. Buyers may see a bit more choice in the weeks ahead, though overall condo inventory still remains relatively tight by historical standards. (SF MLS, InfoSparks)
Months of Supply Shows Just How Tight SF Inventory Has Become
San Francisco remains a very low-inventory market. For single-family homes, months of supply fell to just 0.8 in August, down from 1.5 a year ago and 1.6 in August 2024. Condos have tightened significantly as well, with just 1.8 months of supply in August, compared with 3.5 a year ago and 4.3 in August 2023. The takeaway: buyers have fewer choices across both segments, but the squeeze is especially pronounced for single-family homes. (SF MLS, InfoSparks)