
San Francisco continues to operate with a level of momentum that feels increasingly distinct from the rest of the country, and it’s showing up clearly in the housing market.
The market here remains strong and fast-moving. In March, median single-family home prices reached $2.15M, the highest on record, surpassing the April 2022 peak of $2.05M. Condo prices followed closely at $1.35M, the second-highest ever after April 2022’s $1.375M median price. At the same time, the broader narrative around the city continues to shift in a noticeable way. Rents are at all-time highs (a recent KQED piece highlighted $700/month sleeping pods), and this week’s headline from The San Francisco Standard tells the story of empty nesters returning to San Francisco ahead of what many expect will be another wave of AI-driven demand.
That local strength stands in contrast to a more challenged national backdrop.
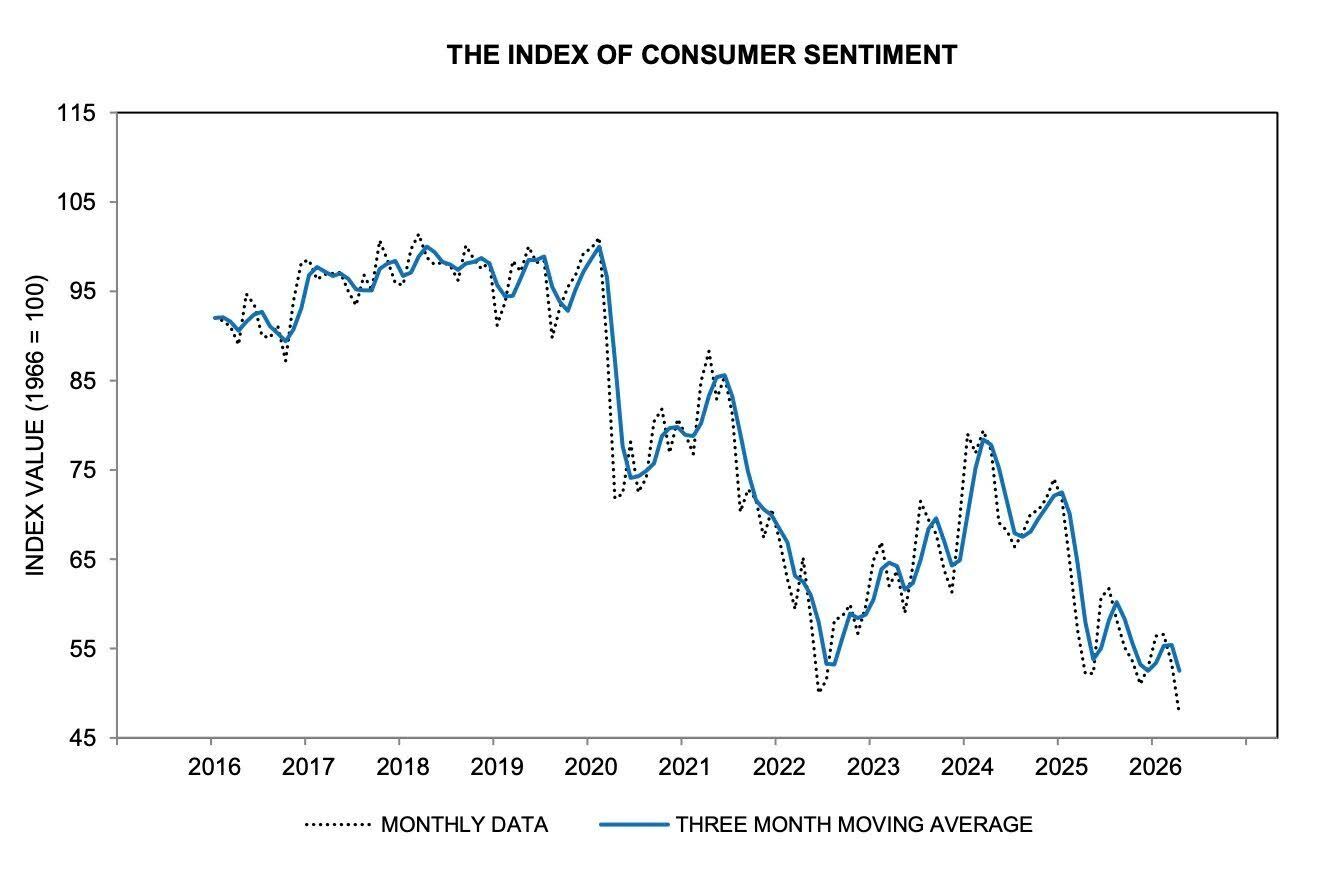
Consumer sentiment across the country has fallen to historic lows, as inflation rose from 2.4% in February to 3.3% in March, driven in large part by rising energy costs. Consumer debt now sits at a record $18 trillion, including $13 trillion in mortgage debt, and more than 5 million student loan borrowers are over 90 days delinquent. At a recent industry conference, economist Rick Sharga described current conditions as the “worst affordability” environment since 1981, with expectations for modest home price growth, fewer transactions, yet relative stability in mortgage rates.
Mortgage rates themselves remain unsettled. After dipping sub 6% earlier this year, they have moved back into the low to mid-6s, reflecting ongoing inflation pressures, uncertainty from the Federal Reserve, and broader global market dynamics. Rather than a clear directional trend, rates have been moving within a range, often shifting quickly.
Within that context, San Francisco continues to show unique dynamics. Cash remains a meaningful component of the market: of the 597 single-family home sales year-to-date, 182 were all cash (approximately 30%). At higher price points, that share increases to 49% of sales over $3M and 52% of sales over $5M. Activity in the luxury realm has also picked up, with 26 sales above $5M in March - the highest monthly total since November 2021.
Consumer confidence locally is holding, and with limited inventory, demand remains the driving force. Well-priced and prepared homes are attracting strong, often competitive interest. For buyers, the key is staying anchored in the most current data, recent sales and pending activity, not comps from even a few months ago.
The Data
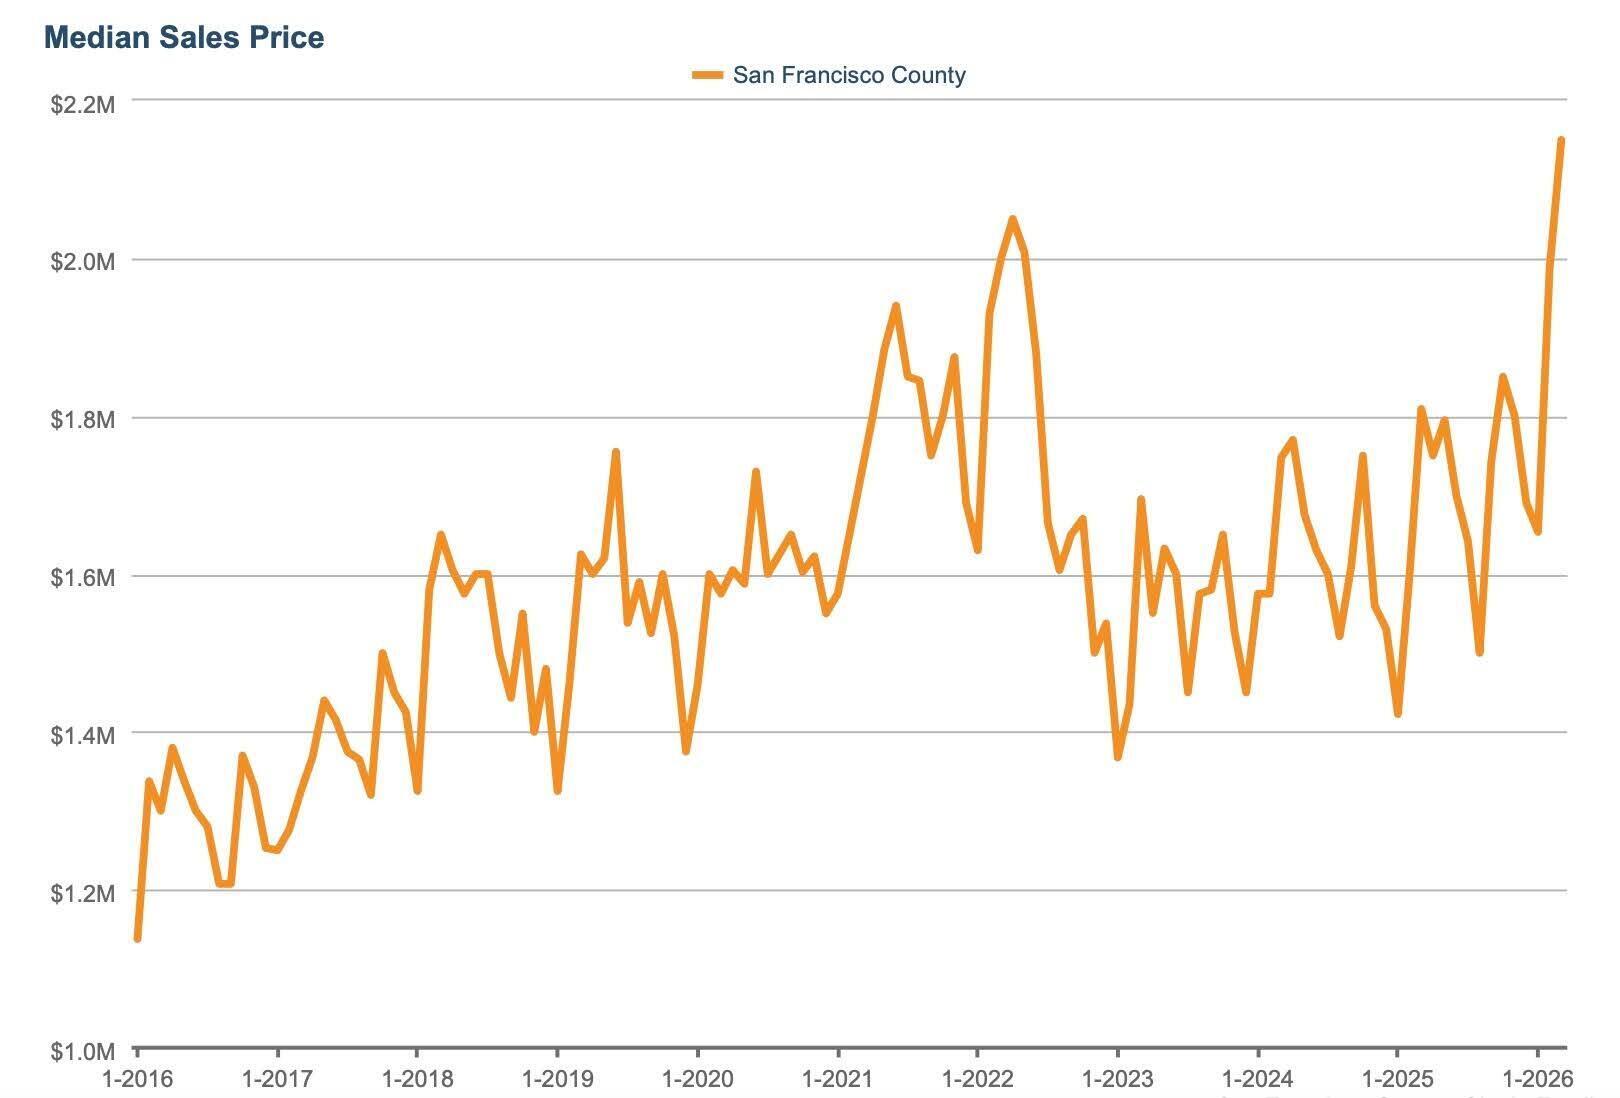
San Francisco’s Housing Prices Continue to Defy Odds
The median single-family home sales price hit a record high of $2,150,000 in March 2026, up from the prior high of $2,050,000 in April 2022. (San Francisco MLS, InfoSparks)
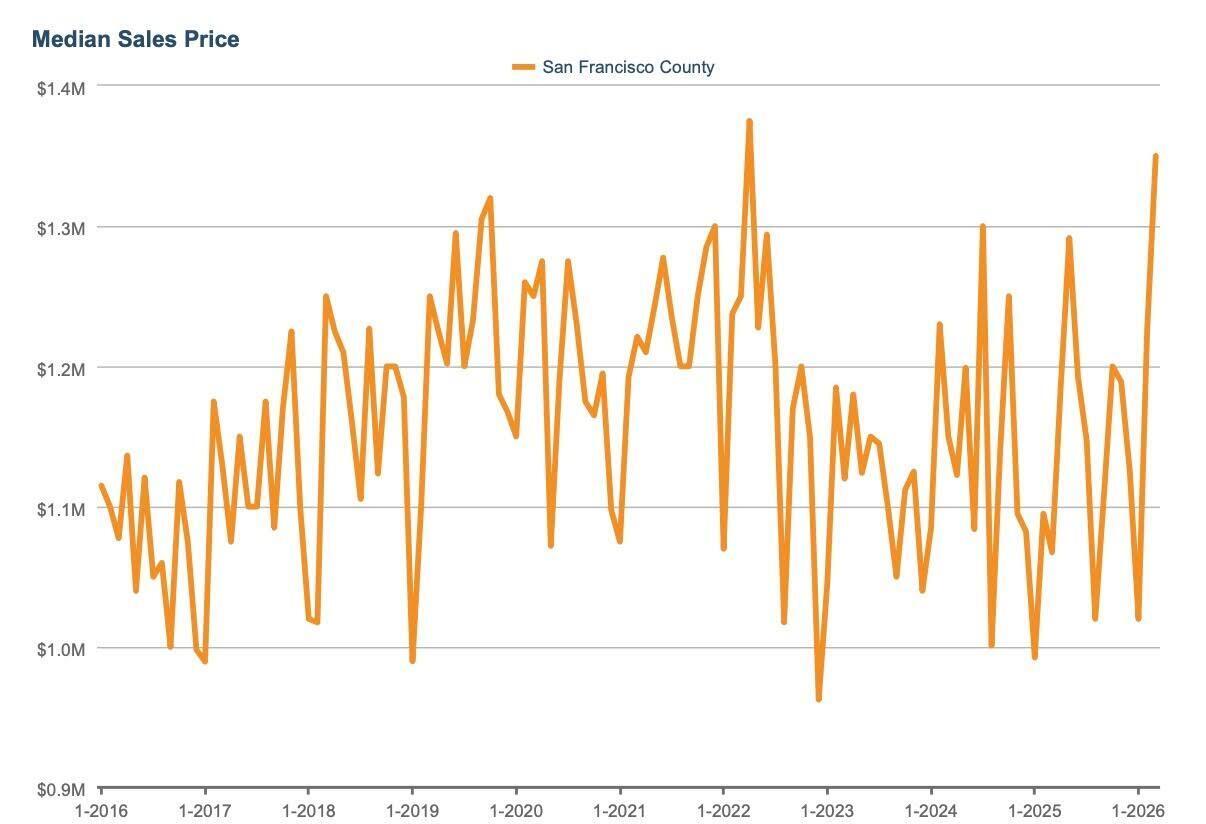
SF Condo Prices Near Record Highs
San Francisco condominium prices are also on the rise, with a median sales price $1,350,000 in March. That was only second to the highest peak on record: $1,375,000 in April 2022. (San Francisco MLS, InfoSparks)
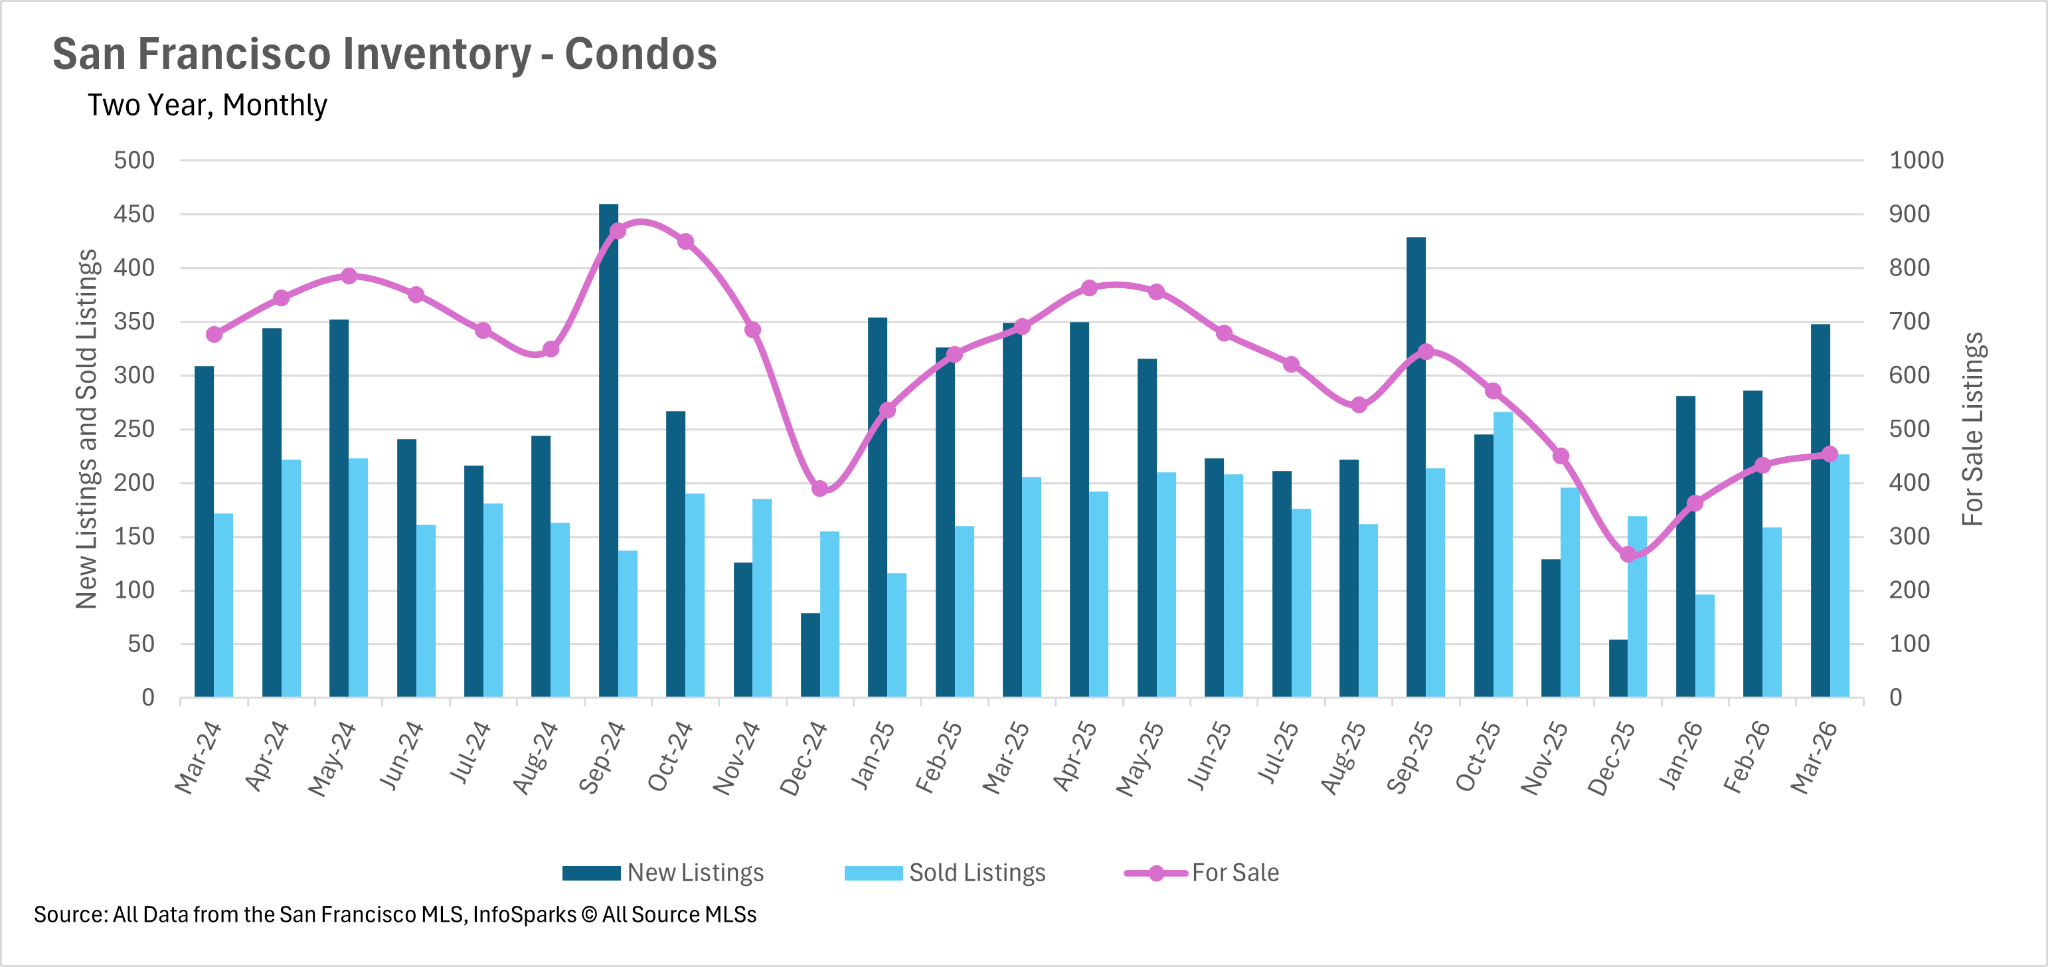
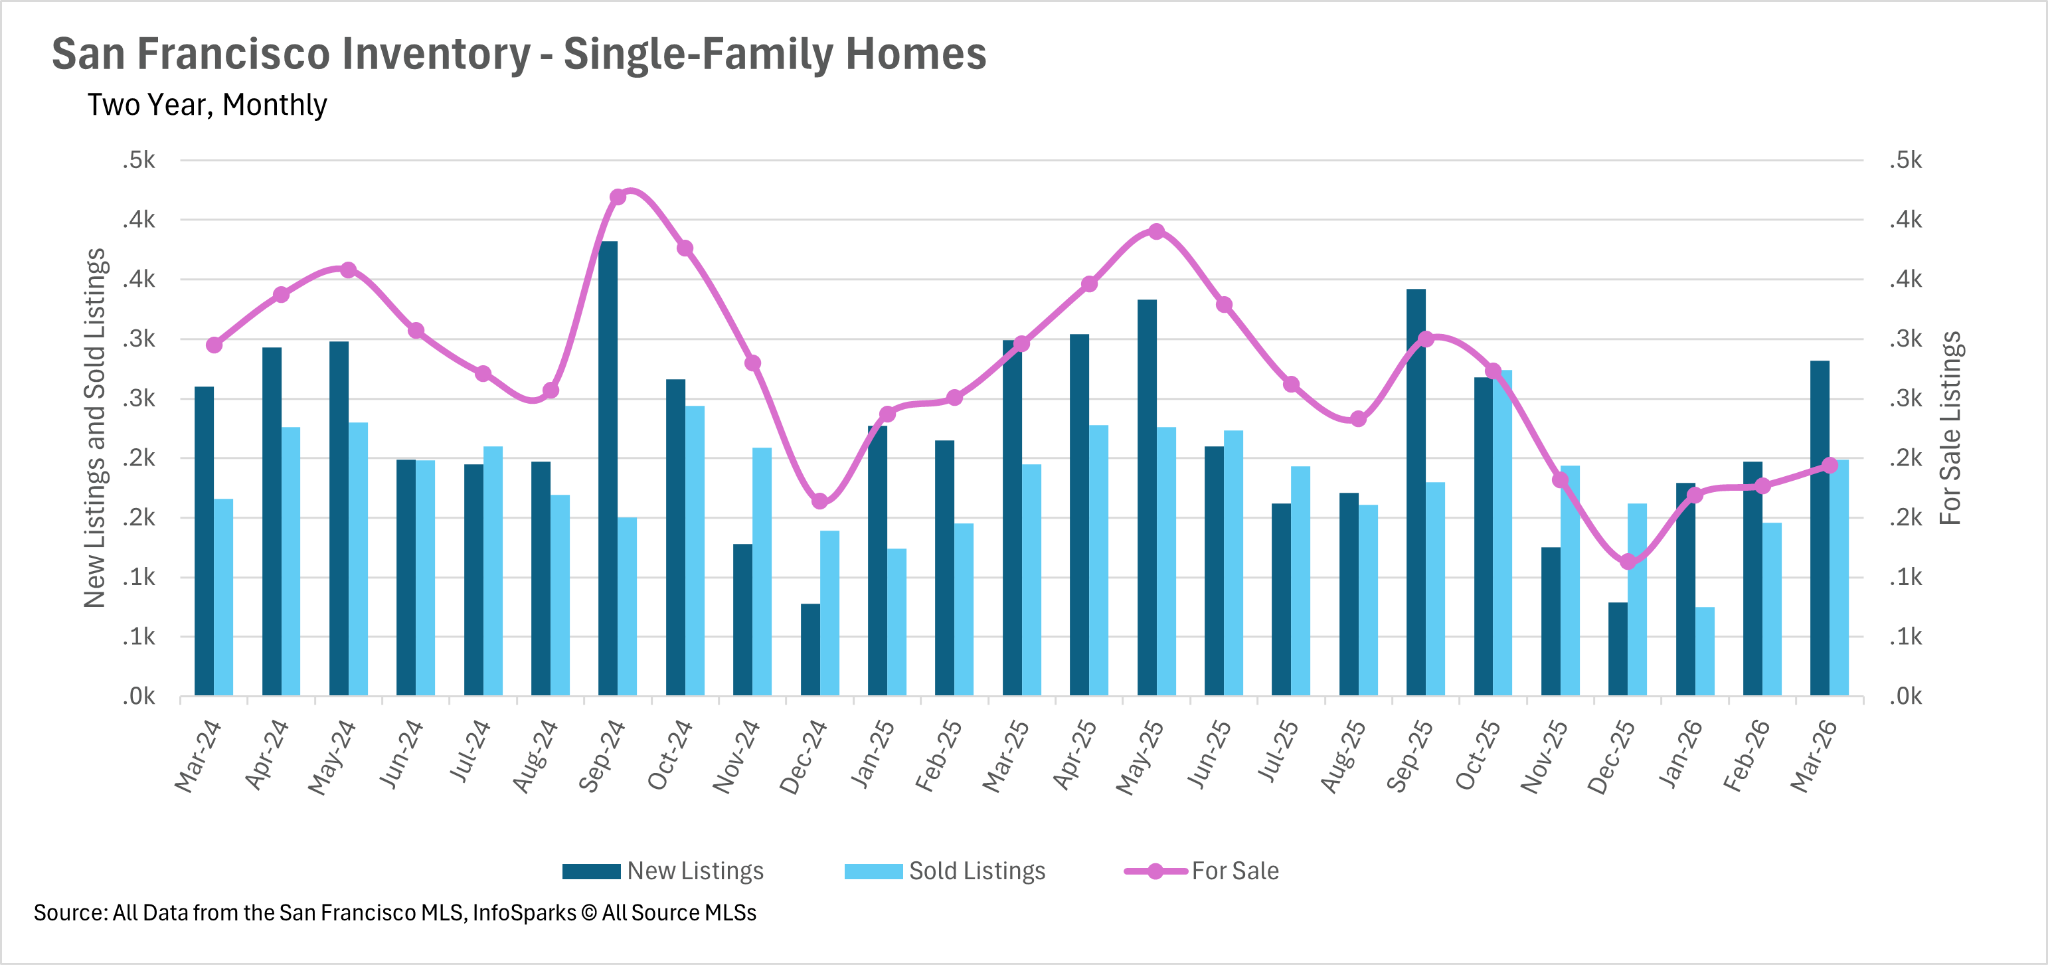
Inventory Still Down Over 30% Year-Over-Year
Even with the typical spring lift in new listings, inventory remains meaningfully below where it was a year ago. There are currently just 202 single-family homes for sale in San Francisco, down 34% year-over-year. Condo inventory tells a similar story, with 454 units on the market, also down roughly 34%. New listings did pick up from February (282 single-family homes and 348 condos), but the pace of sales continues to absorb that supply quickly, keeping overall inventory constrained. As we move further into the spring market, buyers are still navigating a very limited pool of available homes.
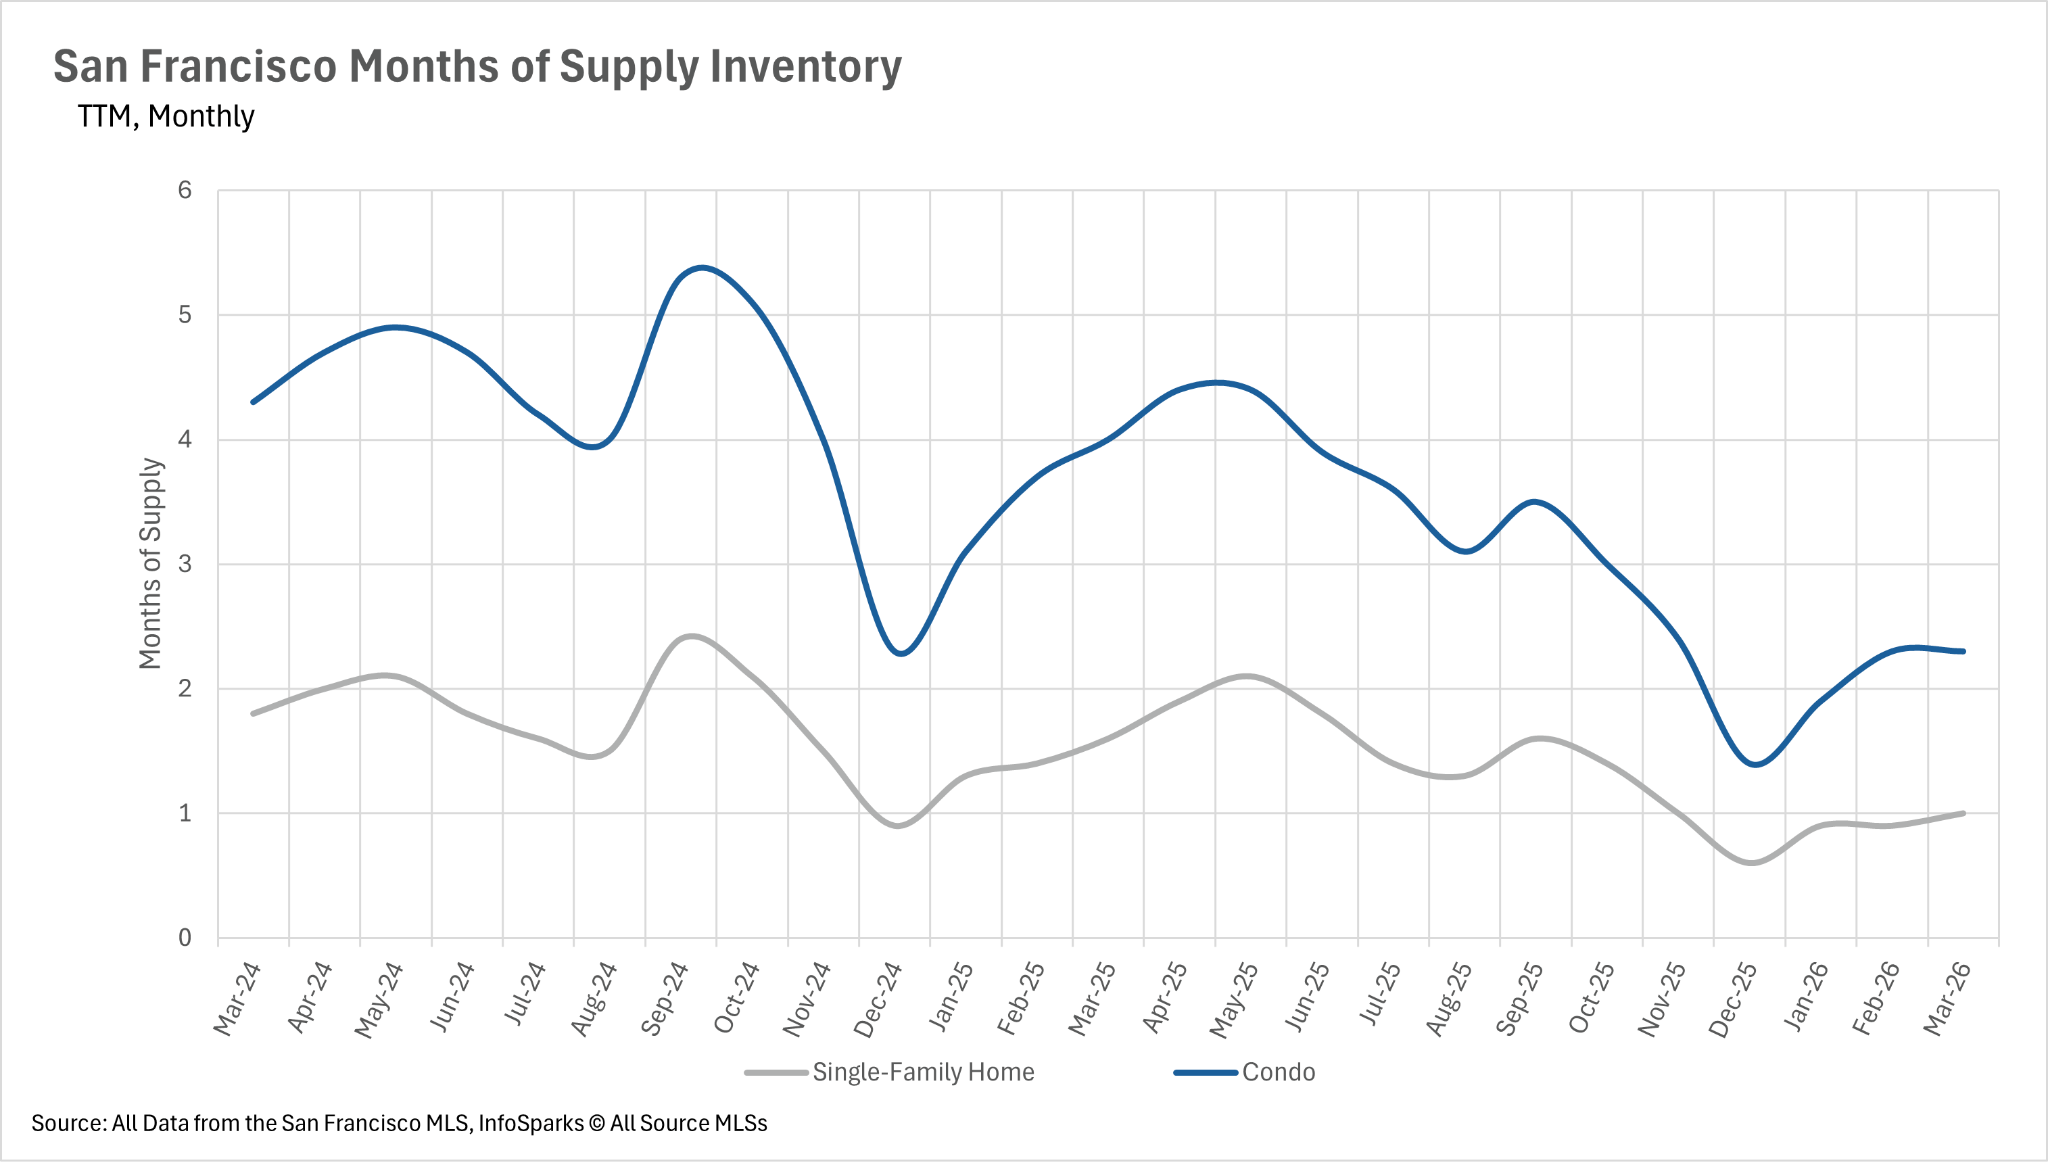
One of the Tightest Seller’s Markets in California
Months of Supply Inventory, or MSI, is one of the clearest ways to understand market balance. Historically, around three months of supply is considered balanced. Anything below that signals a seller’s market, and anything above leans toward buyers. Today, San Francisco is well below that threshold, with just 1.0 months of inventory for single-family homes and 2.3 months for condos. Both are down more than 37% year-over-year, and notably, the condo market has shifted from a buyer-leaning environment last year to a firmly established seller’s market.
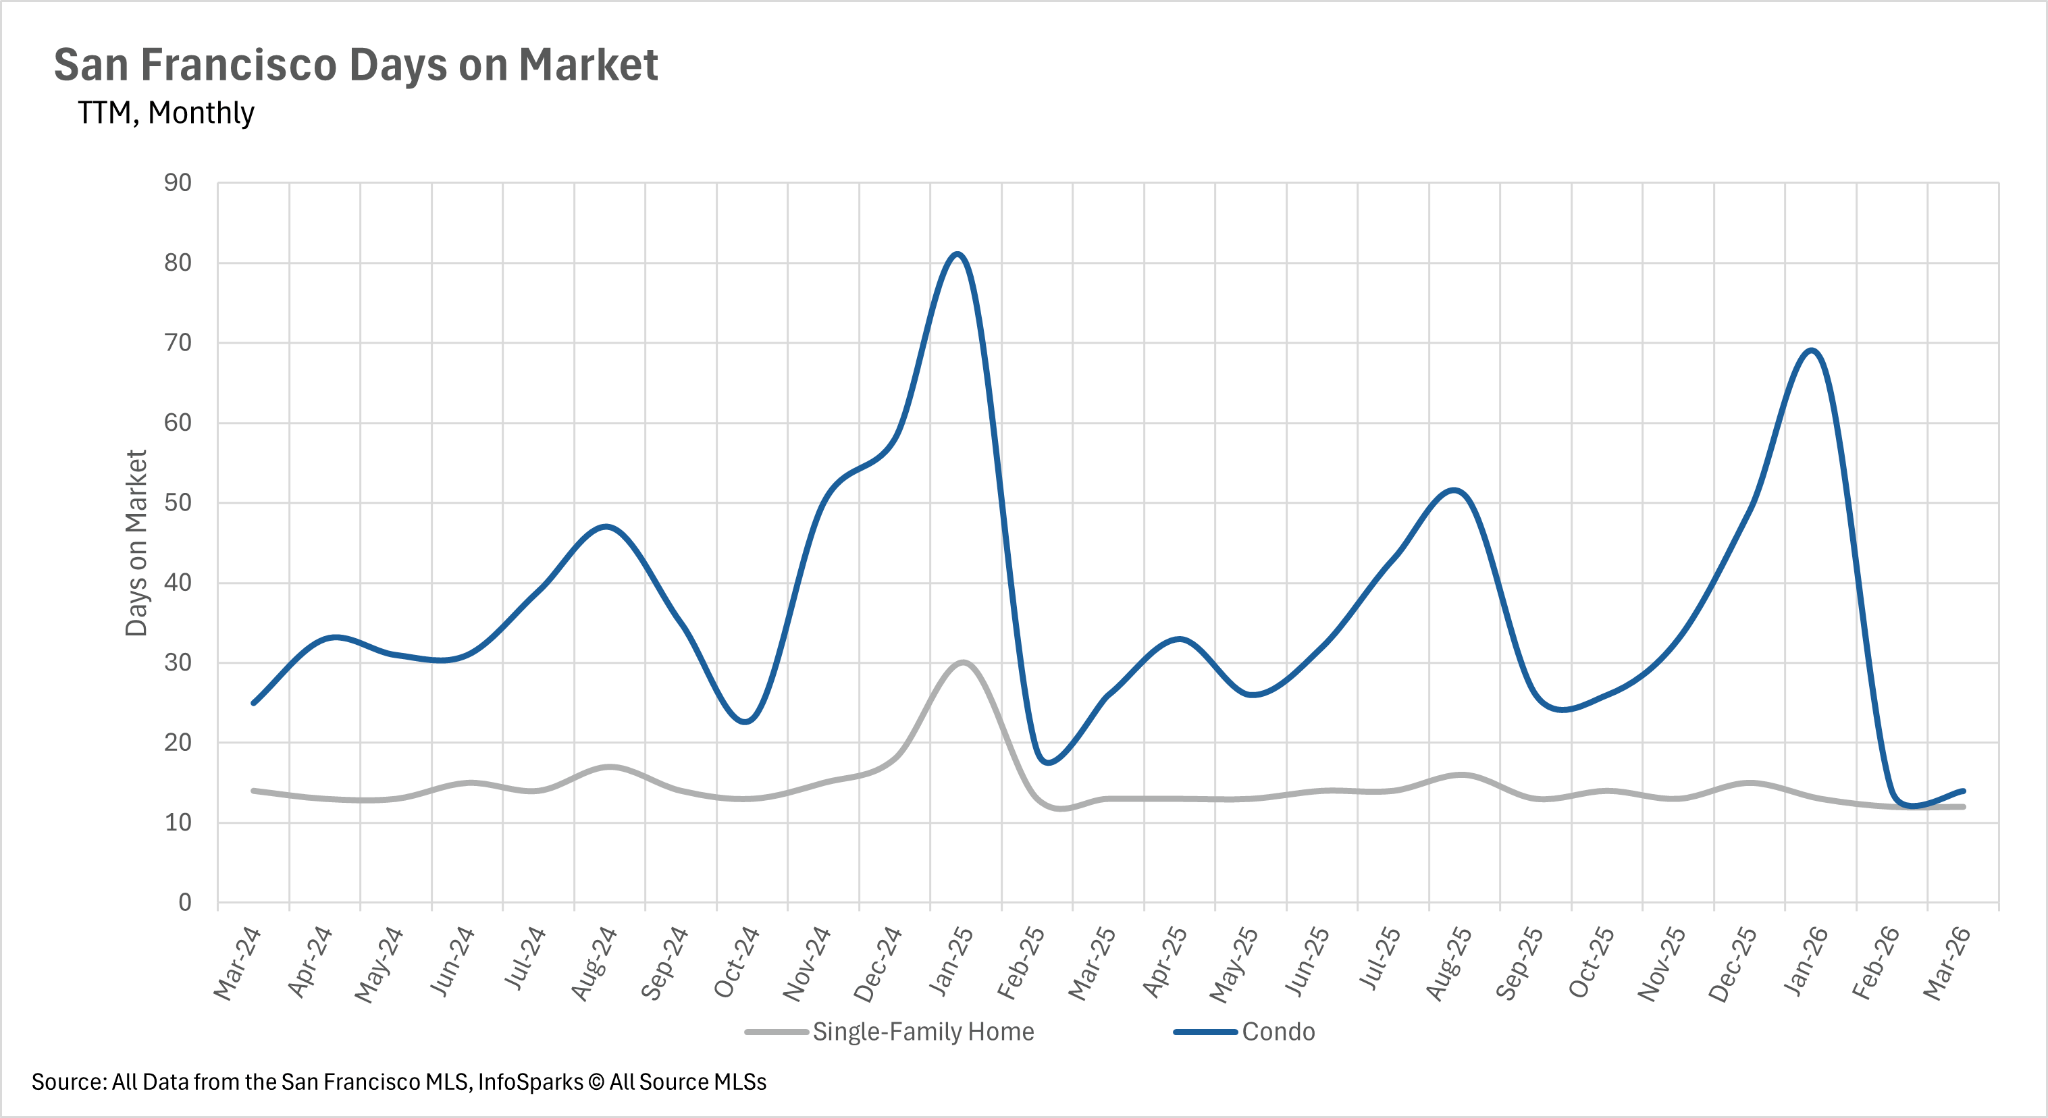
That supply constraint is showing up clearly in how quickly homes are selling. The average single-family home is going into contract in just 12 days, down from last year, while condos are moving in an average of 14 days, a significant year-over-year acceleration. Taken together, these two metrics tell the same story: demand is outpacing supply. Sellers continue to have strong leverage, while buyers are navigating a market where speed and preparation are essential.
That supply constraint is showing up clearly in how quickly homes are selling. The average single-family home is going into contract in just 12 days, down from last year, while condos are moving in an average of 14 days, a significant year-over-year acceleration. Taken together, these two metrics tell the same story: demand is outpacing supply. Sellers continue to have strong leverage, while buyers are navigating a market where speed and preparation are essential.
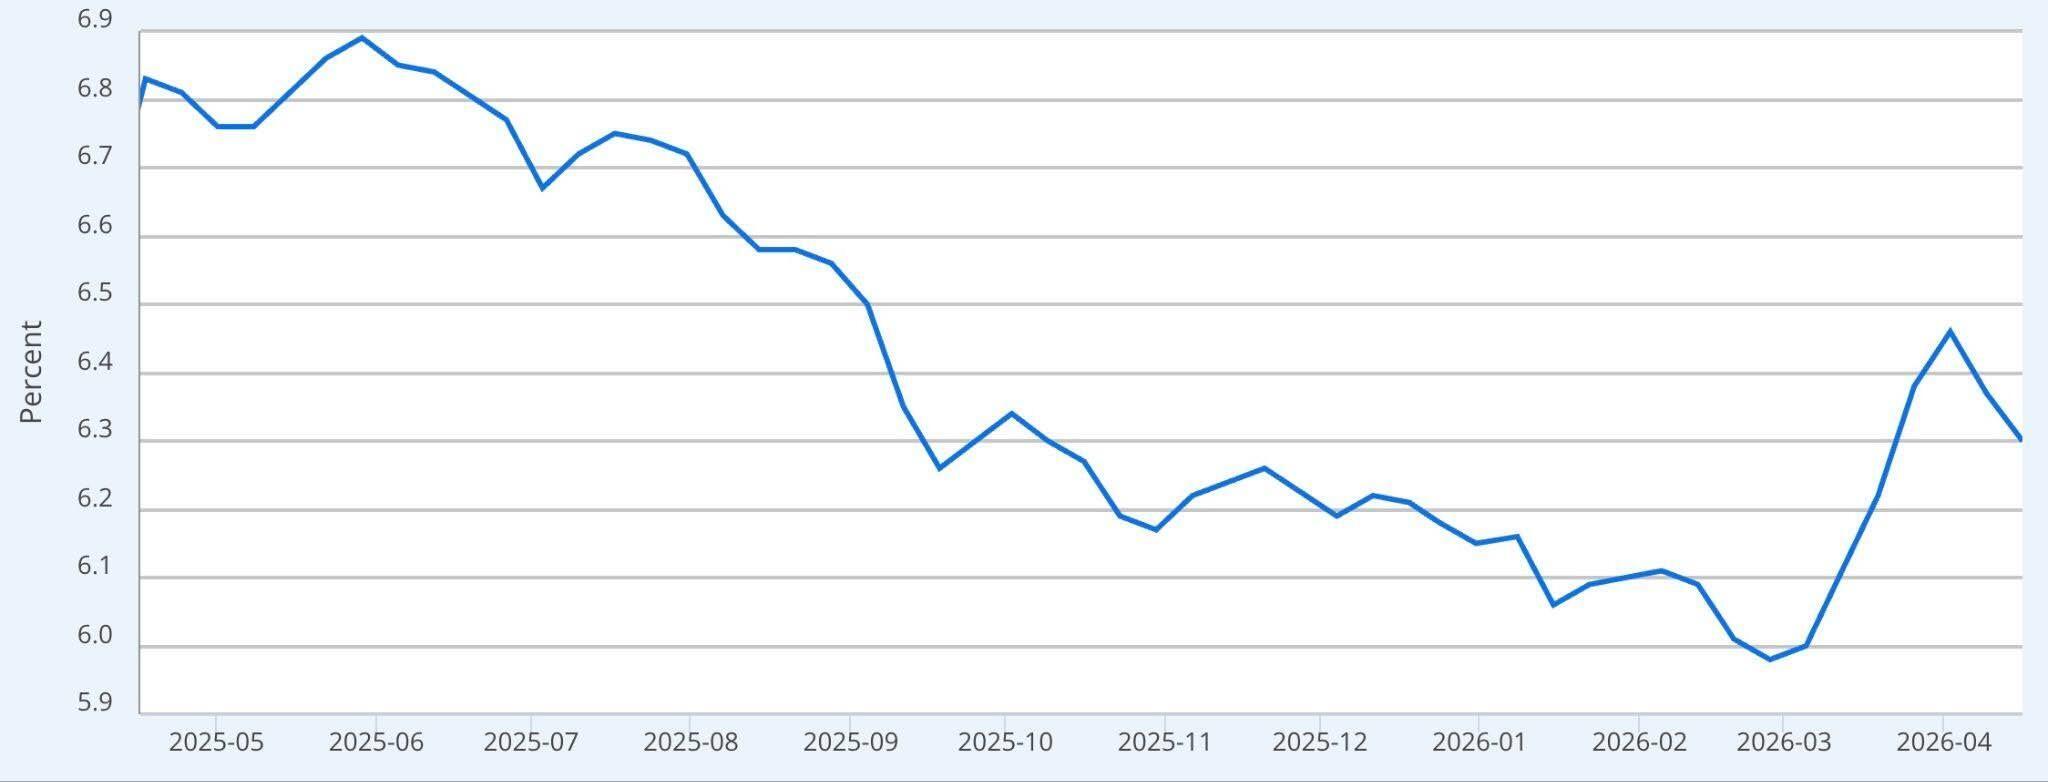
Mortgage Rate Volatility
A steady glide down turned into a sharp rebound as mortgage rates dipped below 6% earlier this year before quickly jumping back into the mid-6s, a clear reminder of today’s volatility. (Freddit Mac via FRED)
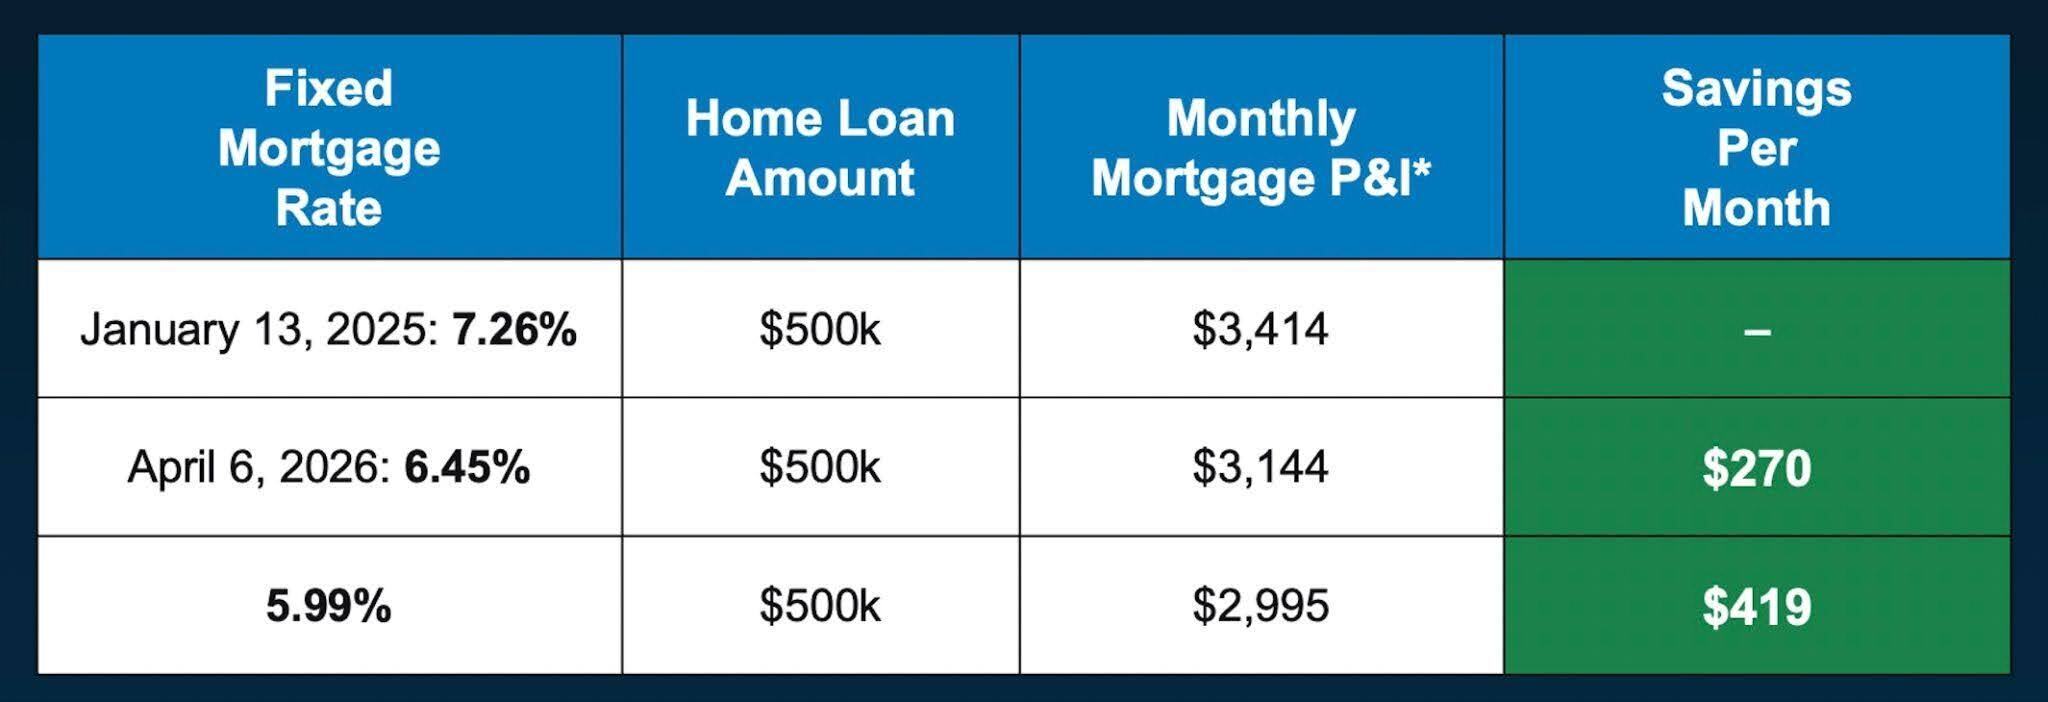
What Rate Changes Mean Monthly
Rates are down from last year, and even modest shifts are creating meaningful changes in monthly affordability. This chart takes into account principal and interest payments, but total monthly payments are also impacted by property taxes, HOA dues, insurance costs and other fees. (Keeping Current Matters)
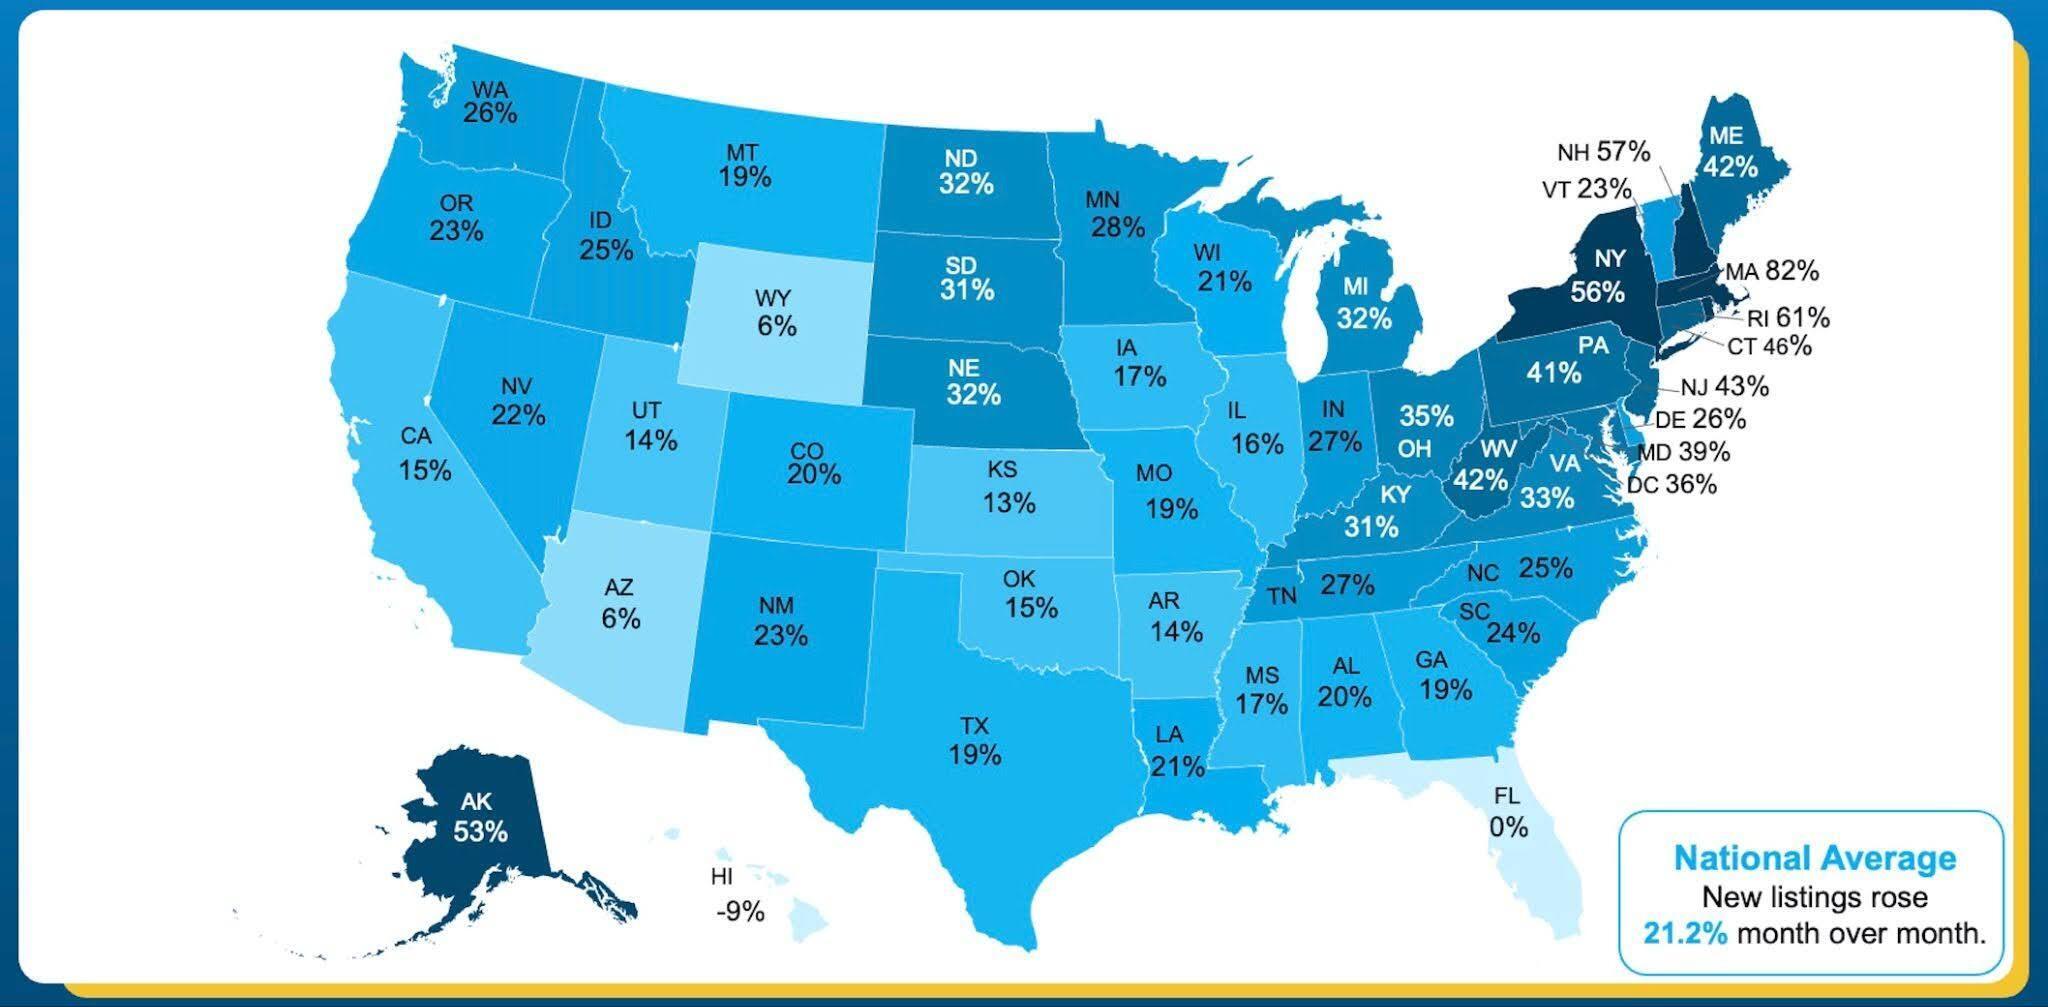
Nationwide: Where New Listings Are Gaining Momentum
New listings saw a seasonal increase across the country in March, rising 21.2% month over month, but inventory levels remain uneven depending on the region.
Consumer Sentiment Declines
Consumer sentiment declined sharply this month, down roughly 11% and continuing a slide that began with the onset of the Iran conflict. Sentiment now sits about 9% below where it was a year ago, with declines seen across all age groups, income levels, and political affiliations, underscoring how broad-based this shift has been. (University of Michigan)