
DK Group
Bay Bridge illuminated at night, leading toward the San Francisco skyline across the water.

Froth… or the New Normal?

Bidding Wars Are Now the Baseline
Bidding wars are no longer the exception in San Francisco — they’re the standard. At least for homes that are thoughtfully priced, beautifully presented, and perfectly aligned with today’s buyer expectations.
At Vantage, we recently sold a Bernal Heights home for $850,000 over asking — and roughly $650,000 beyond what the sellers ever imagined. But it’s not just the headline price that’s turning heads -- it’s the strength of the offers. Many are all cash. Most are completely non-contingent. Clean. Decisive. Highly competitive.
 
So… Froth or Something More Durable?
That naturally raises the question: is this a moment of excess or a more enduring shift?
Nationally, the picture is far less certain. Geopolitical tension is beginning to weigh on consumer confidence. Mortgage applications dropped nearly 10% last week alone — a clear signal that many buyers are stepping back. Historically, war, rising fuel costs, and economic uncertainty slow markets down.
And yet, San Francisco is doing the opposite.
 
San Francisco: An Economic Outlier
Right now, San Francisco is behaving less like a fragile market — and more like an economic fortress.
A powerful wave of AI-driven capital has reignited the local economy, paired with a renewed sense of optimism and civic pride. There’s a shift you can feel — on the streets, in conversations, and most clearly, in how buyers are behaving.
 
Confidence Is Driving the Market
That renewed confidence is translating directly into housing.
Rents are rising. Home prices are climbing. And most tellingly, buyers are acting with conviction - moving quickly, writing strong offers, and competing at levels we haven’t seen in years.
 
For Sellers: A Window of Opportunity (With a Caveat)
This is a powerful moment for sellers — but strategy matters more than ever.
The sales you see online are already stale. The real story is unfolding in the pending data: how many offers are coming in, where pricing is landing, and how buyers are behaving in real time. Those are the comps that will set the next benchmark.
 
For Buyers: The Rules Have Changed
For buyers, the takeaway is just as critical.
The data you’re seeing online may not reflect today’s reality. Winning requires real-time intelligence, sharp positioning, and the ability to act decisively when the right opportunity appears.
 
A Quick Take on the Numbers
Prices are surging: Single-family home values jumped more than 21% year-over-year
 
Inventory is critically low: Down nearly 40% across both houses and condos
 
Speed is accelerating: Homes are selling in 12–14 days on average
 

The Data

Inventory is Seasonal

Across the country, inventory follows a predictable pattern - building into the spring selling season. This chart shows the average number of new listings by month over the past decade. (Keeping Current Matters, Realtor.com)
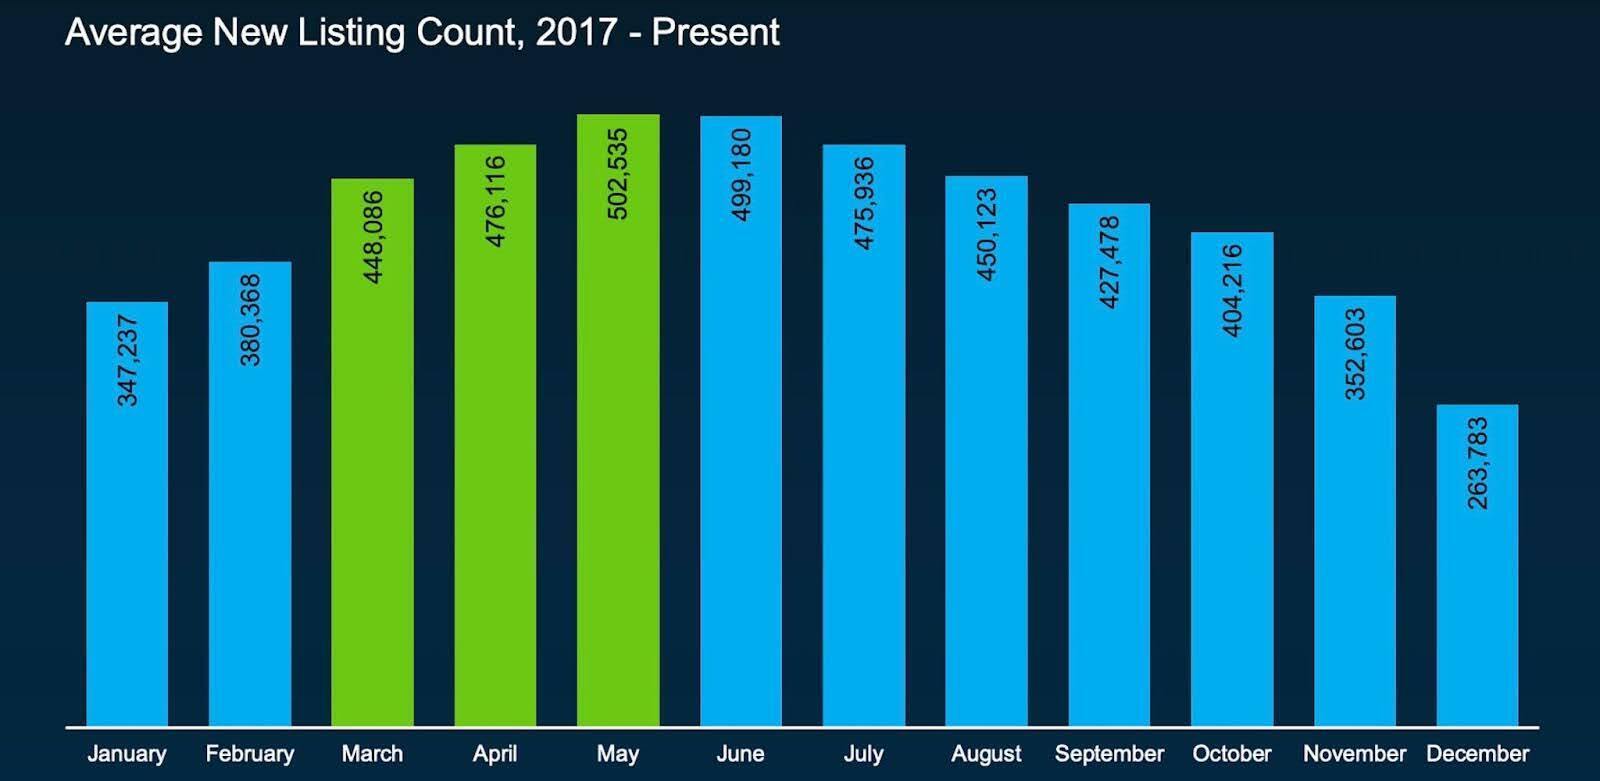
Bar chart of average new listings by month, peaking at 502,535 in May and declining to 263,783 in December.
 
Inventory Recovery: Nationally, not Locally
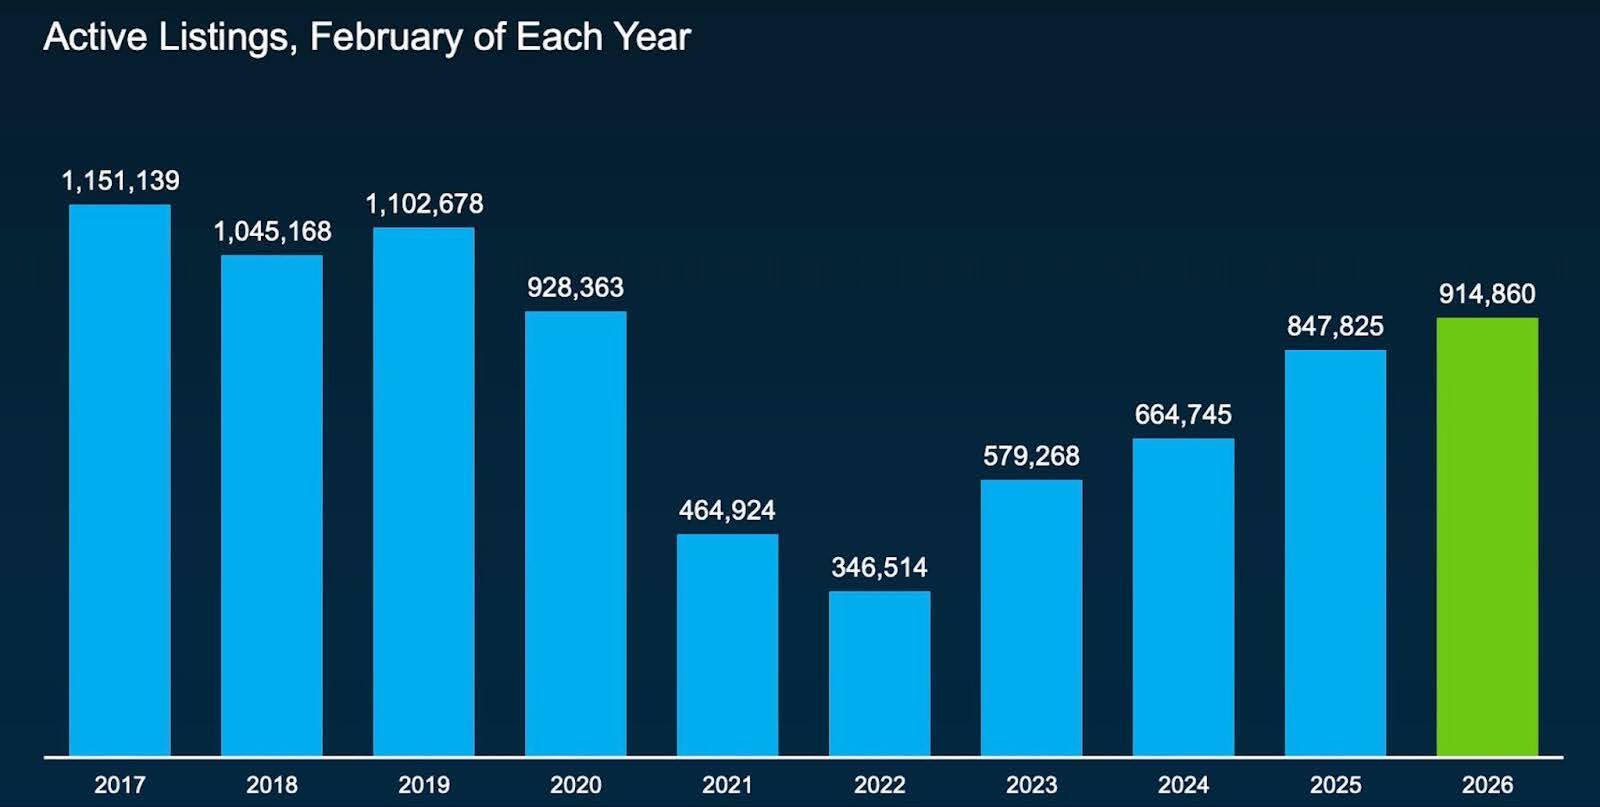
While inventory is rebounding across much of the U.S., reaching levels not seen since 2020, San Francisco remains the exception, with supply still severely constrained. (KCM, Realtor.com)
 
February active listings fell to 346,514 in 2022, then rose to 914,860 in 2026.
 
Spring = Speed
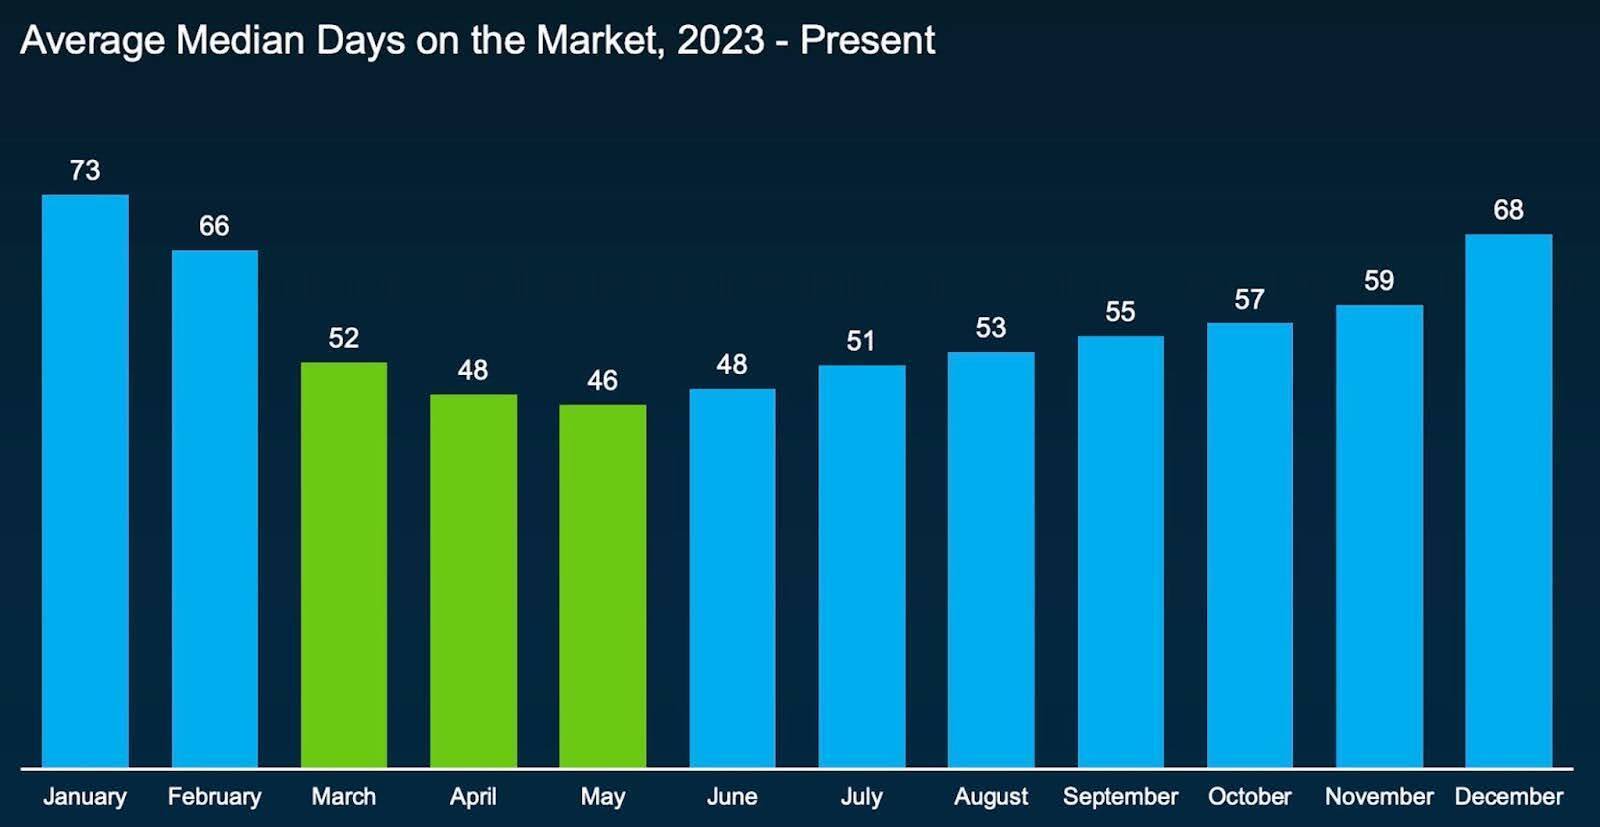
Spring consistently brings a more active buyer pool, resulting in faster sales. This seasonal acceleration is happening nationally. But in San Francisco, it’s amplified. (KCM, Realtor.com)
 
Chart of average median days on market by month, falling from 73 in January to 46 in May, then rising to 68 in December.
 
Mortgage Rates Holding Steady

As of March 19, the average 30-year fixed rate sits at 6.22%, slightly above last month, but below March 2025 levels. The Fed has paused further rate cuts amid geopolitical uncertainty. (Federal Reserve Bank of St. Louis)
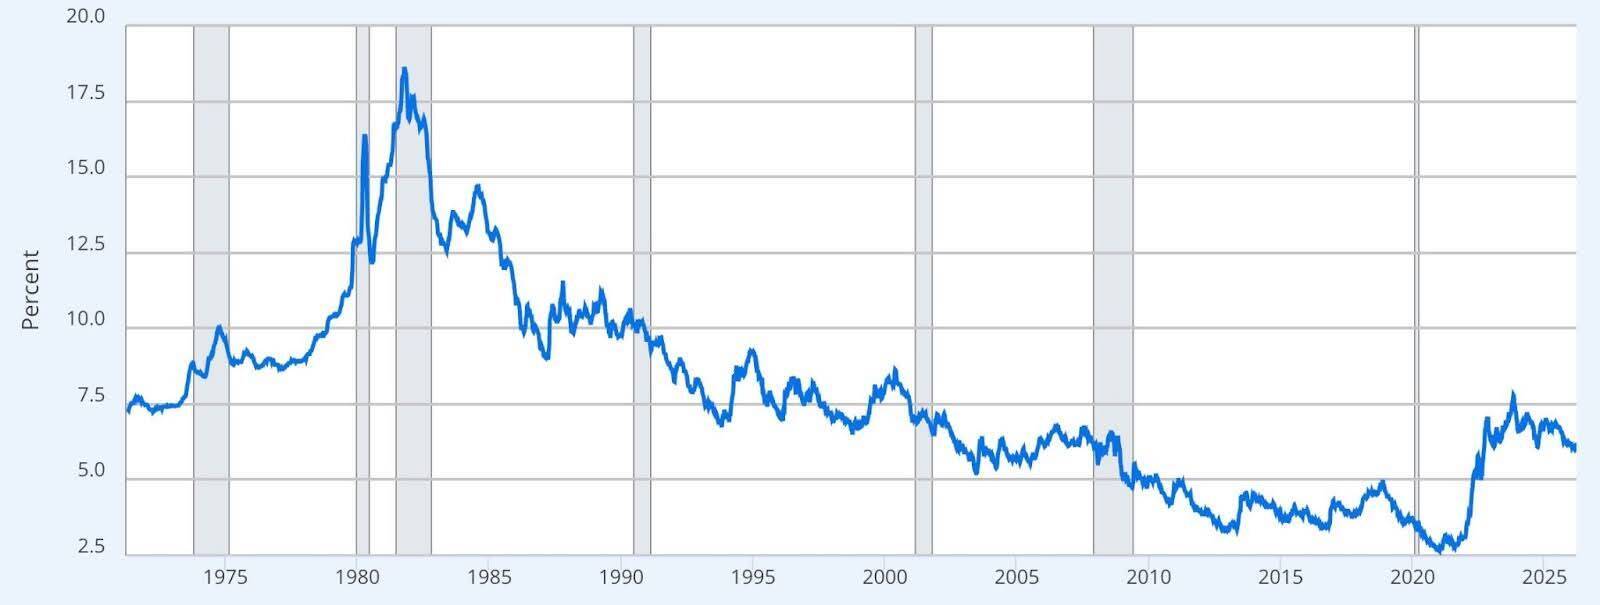
Line chart of percentage rates from the early 1970s to 2025, peaking near 18% in 1981 and bottoming near 2.5% in 2021.


Labor Market Slightly Softening


Unemployment ticked up to 4.4% in February - still low historically, but signaling a modest cooling in hiring. This reflects a more cautious national backdrop, even as San Francisco continues to outperform. (BLS)
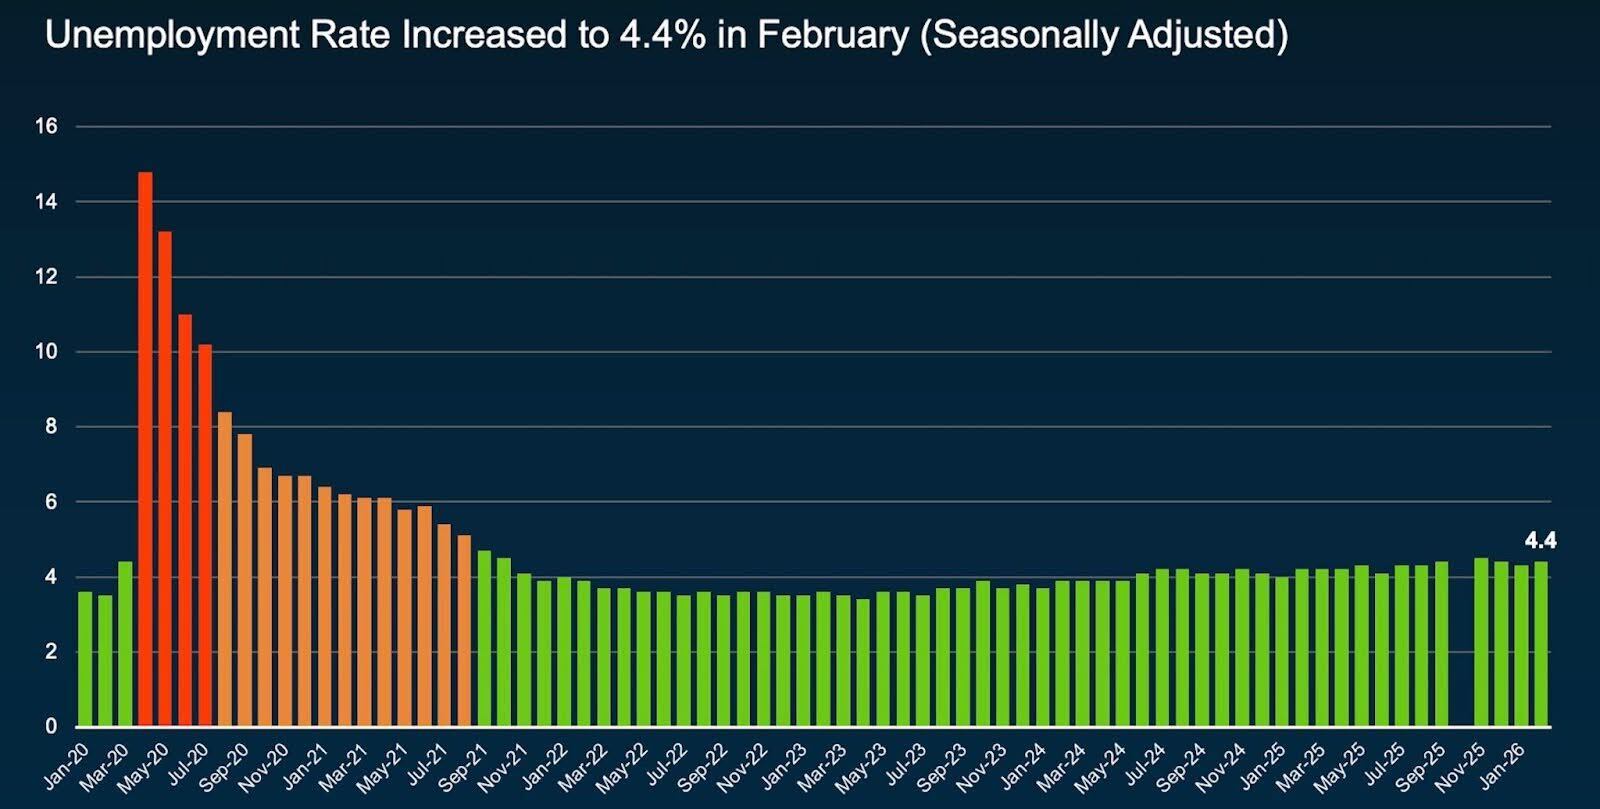
Bar chart of seasonally adjusted unemployment rates from January 2020 to January 2026, ending at 4.4%.


Inventory Levels Remain at Historic Lows Throughout San Francisco

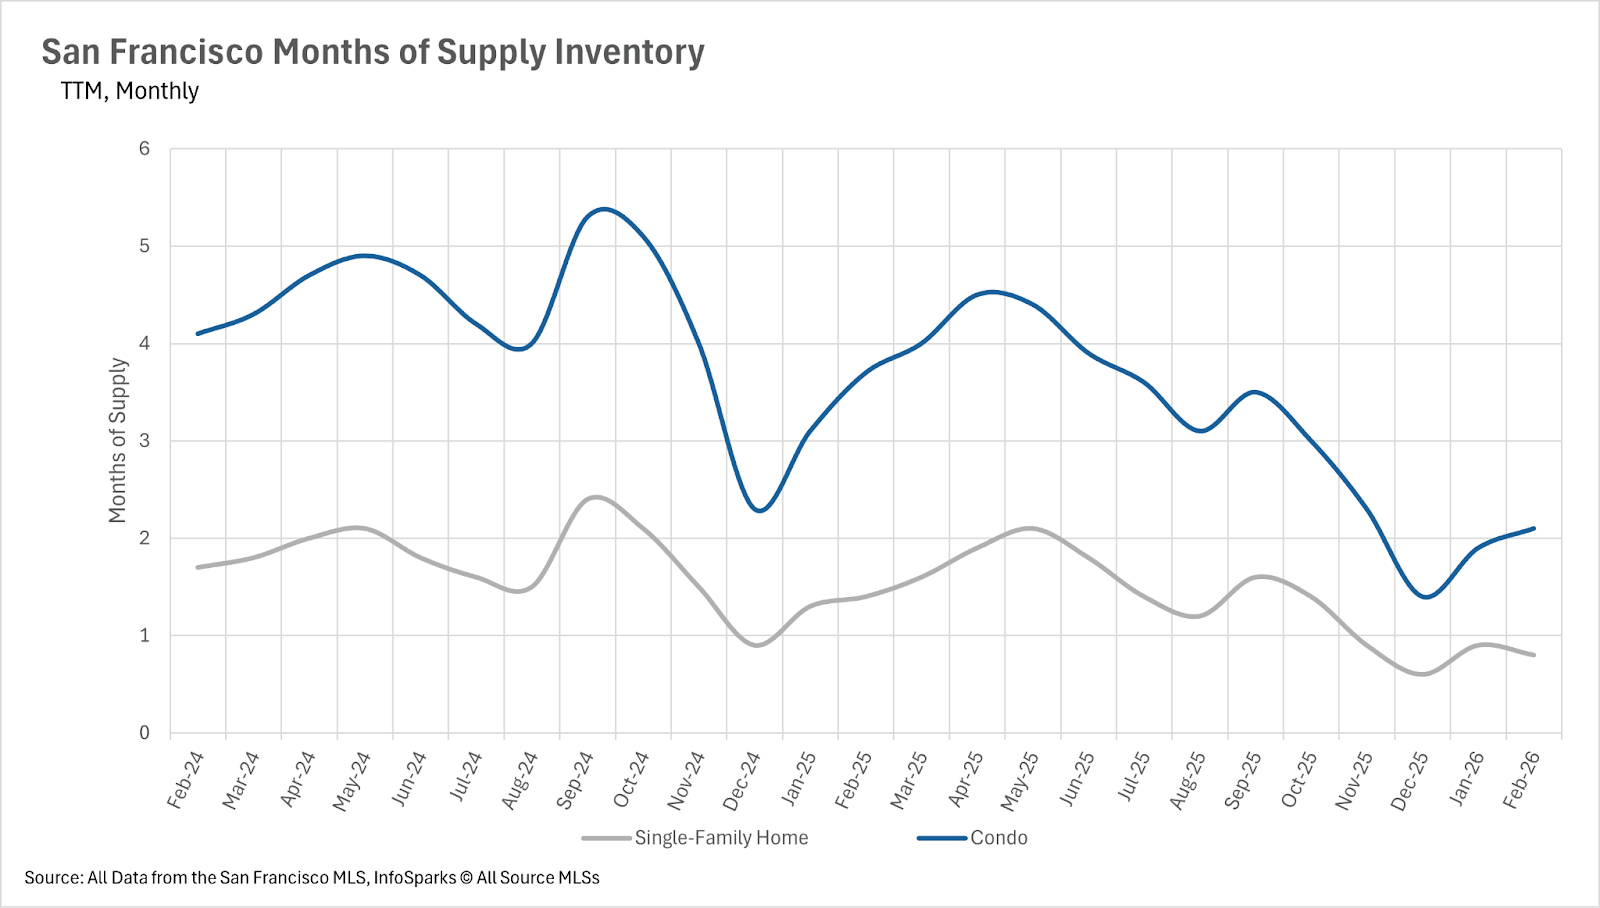
Despite the typical spring uptick in new listings, inventory levels remain drastically below where they were a year ago. There are currently just 157 single-family homes for sale in San Francisco, representing a 37.45% decline compared to February 2025. The condo market is experiencing a similar shortage, with inventory down 38.81% year-over-year to just 391 units. Combined, there are fewer than 550 homes available for sale in the entire city. Until more homeowners decide to list their properties, this severe supply crunch will continue to fuel intense competition among buyers.
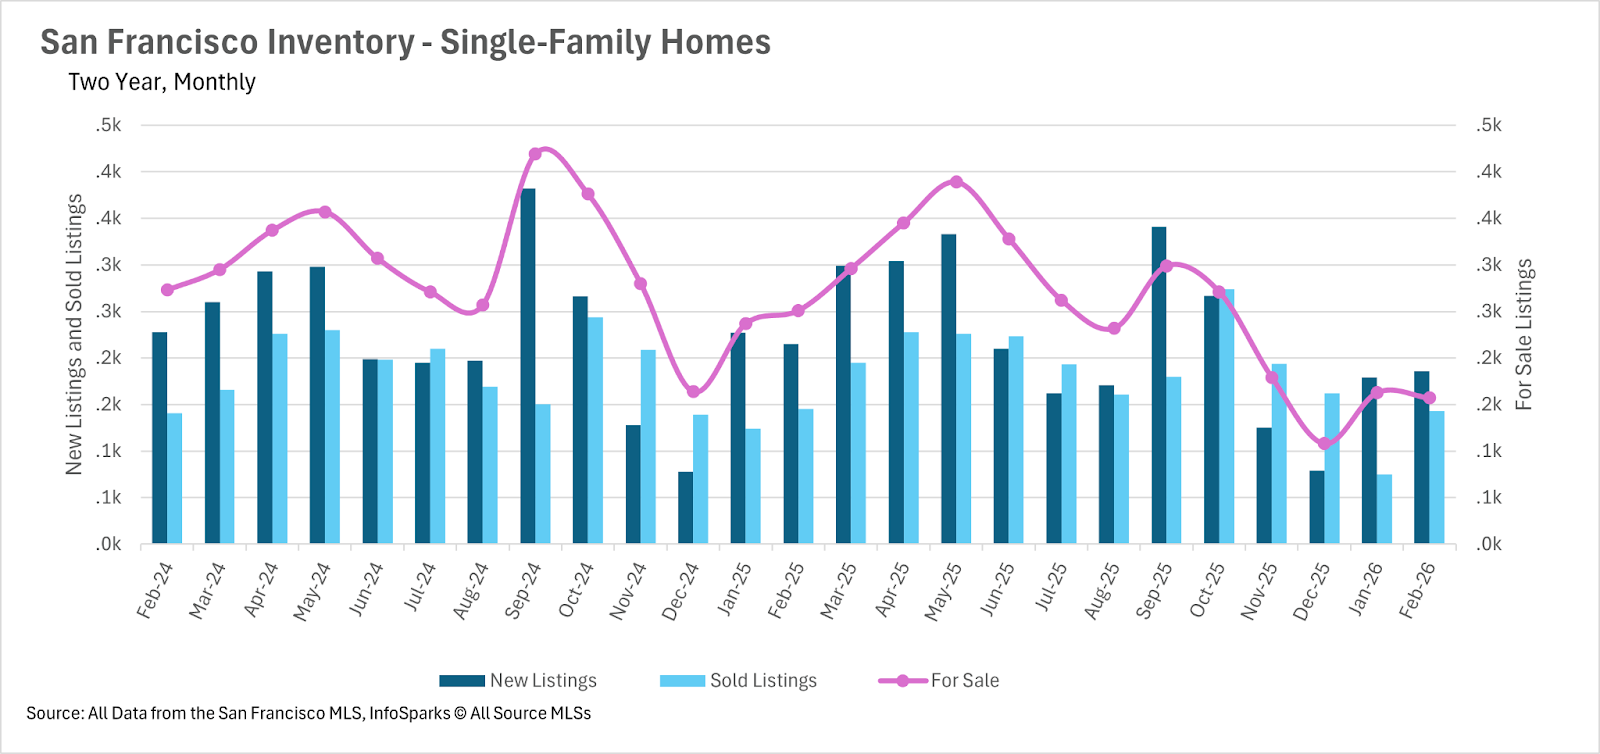
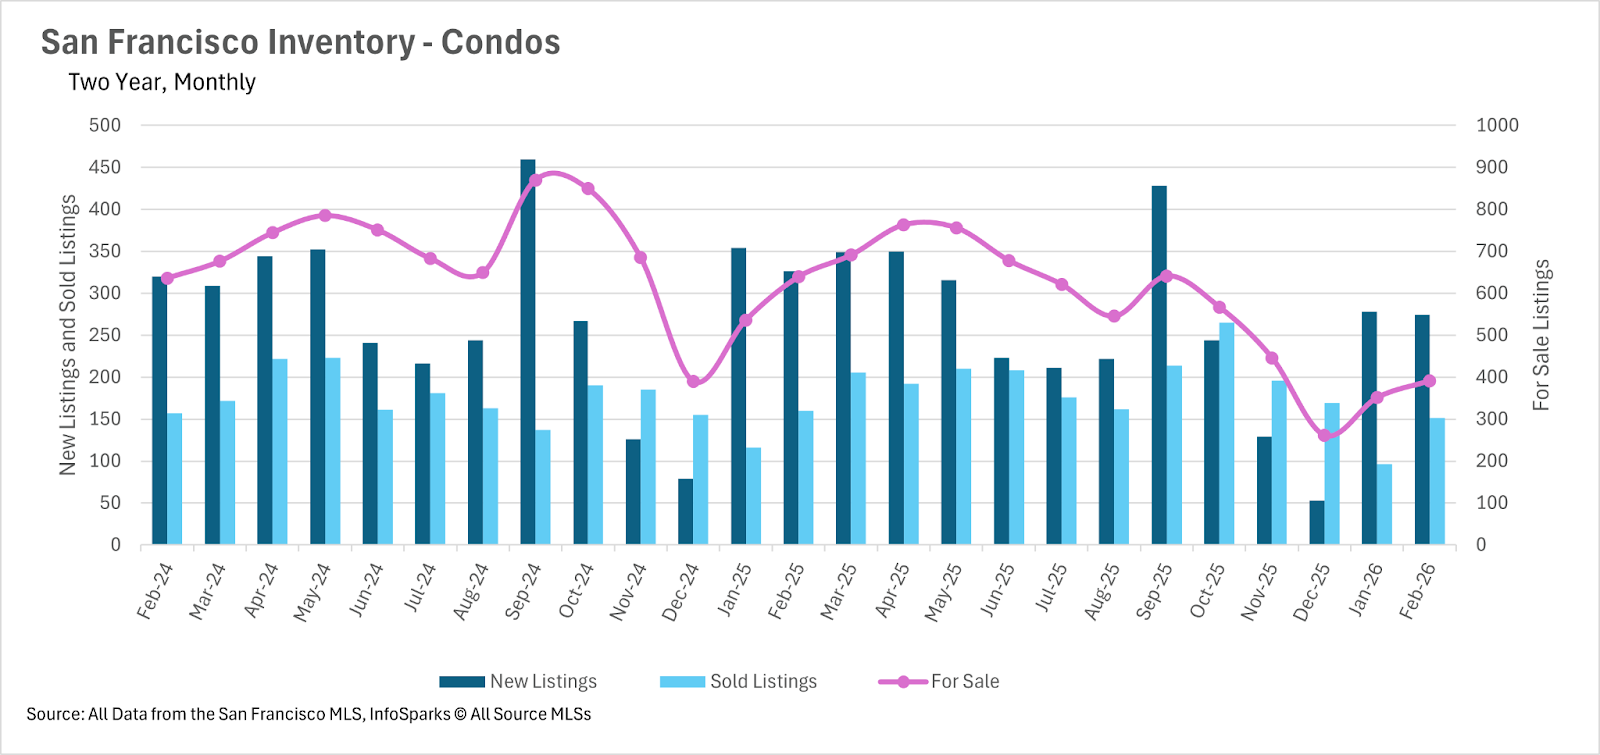
Chart of San Francisco single-family home inventory, showing monthly new listings, sold listings, and homes for sale from February 2024 to February 2026.

Chart of San Francisco condo listings, with monthly new and sold listings and homes for sale from February 2024 to February 2026.

Chart comparing San Francisco condo and single-family home months of supply from February 2024 to February 2026.

Home Selling at a Blistering Pace in San Francisco


With inventory at such critically low levels, listings are being snapped up almost as soon as they hit the market. The average single-family home is selling in just 12 days, representing a 7.69% decrease compared to last February. The condo market has seen an even more dramatic acceleration, with the average condo selling in just 14 days, a 26.32% year-over-year decline. This rapid pace means buyers must be prepared to act immediately when a desirable property becomes available, leaving little room for deliberation in this ultra-competitive market.
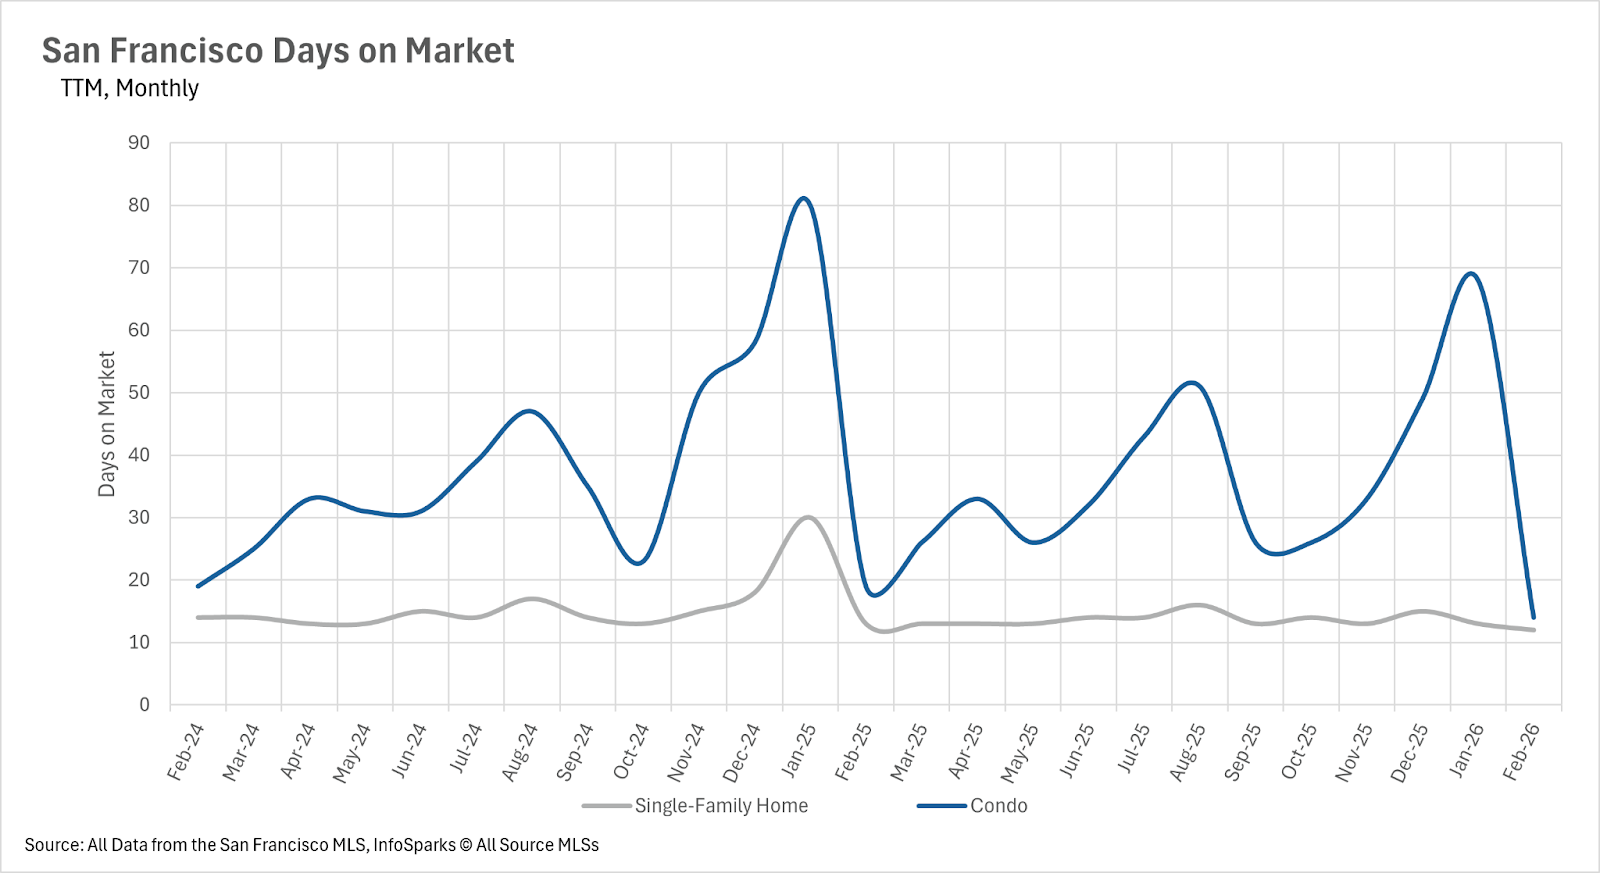
Chart compares monthly San Francisco days on market for condos and single-family homes, February 2024–February 2026.

San Francisco's Housing Market is on Fire to Start 2026


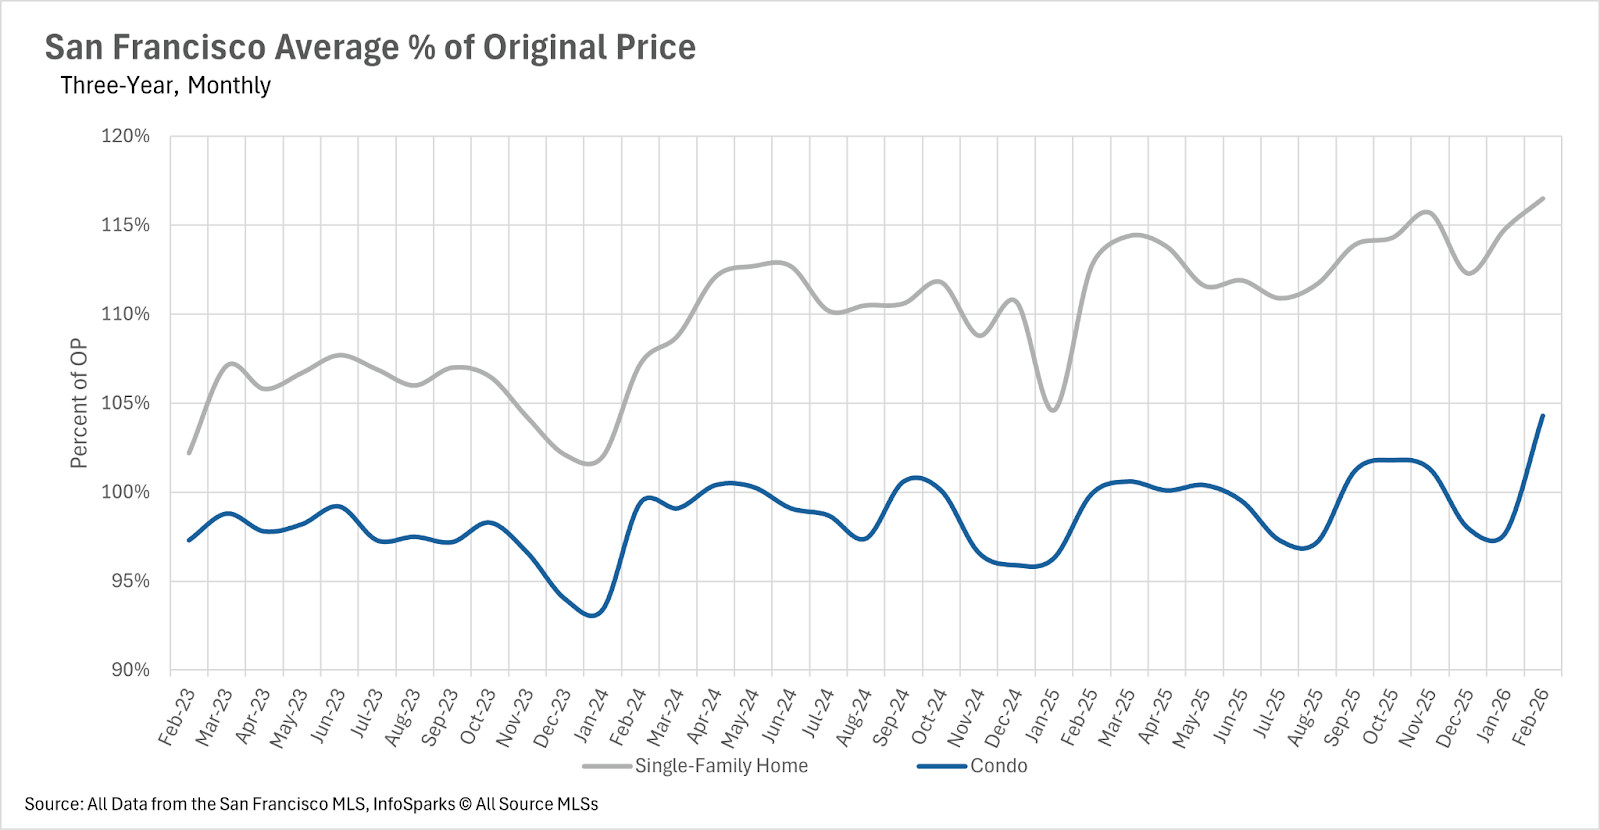
February brought extraordinary price appreciation to San Francisco, with both single-family homes and condos posting impressive year-over-year gains. Single-family homes saw a remarkable 21.41% increase in median sale price, with the median home selling for $1,942,500. Condos also had an exceptional month, with the median sale price climbing 11.87% to $1,225,000. The competition for homes has reached a fever pitch, with single-family homes selling for 16.5% over the original asking price on average, and condos selling for 4.3% over asking. This marks one of the strongest months for condo premiums in recent memory.
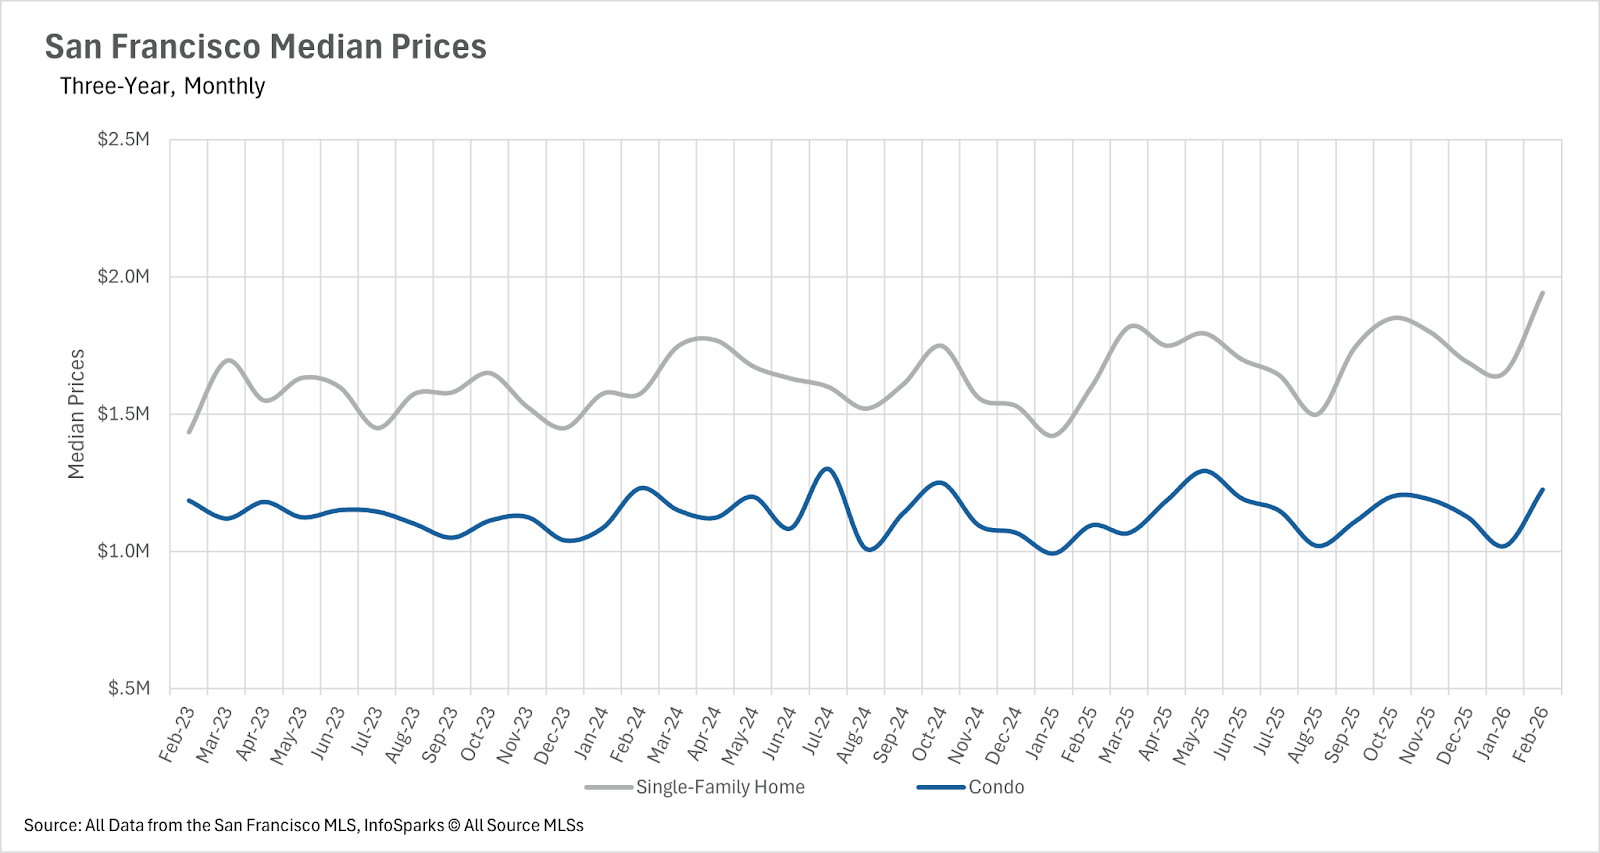
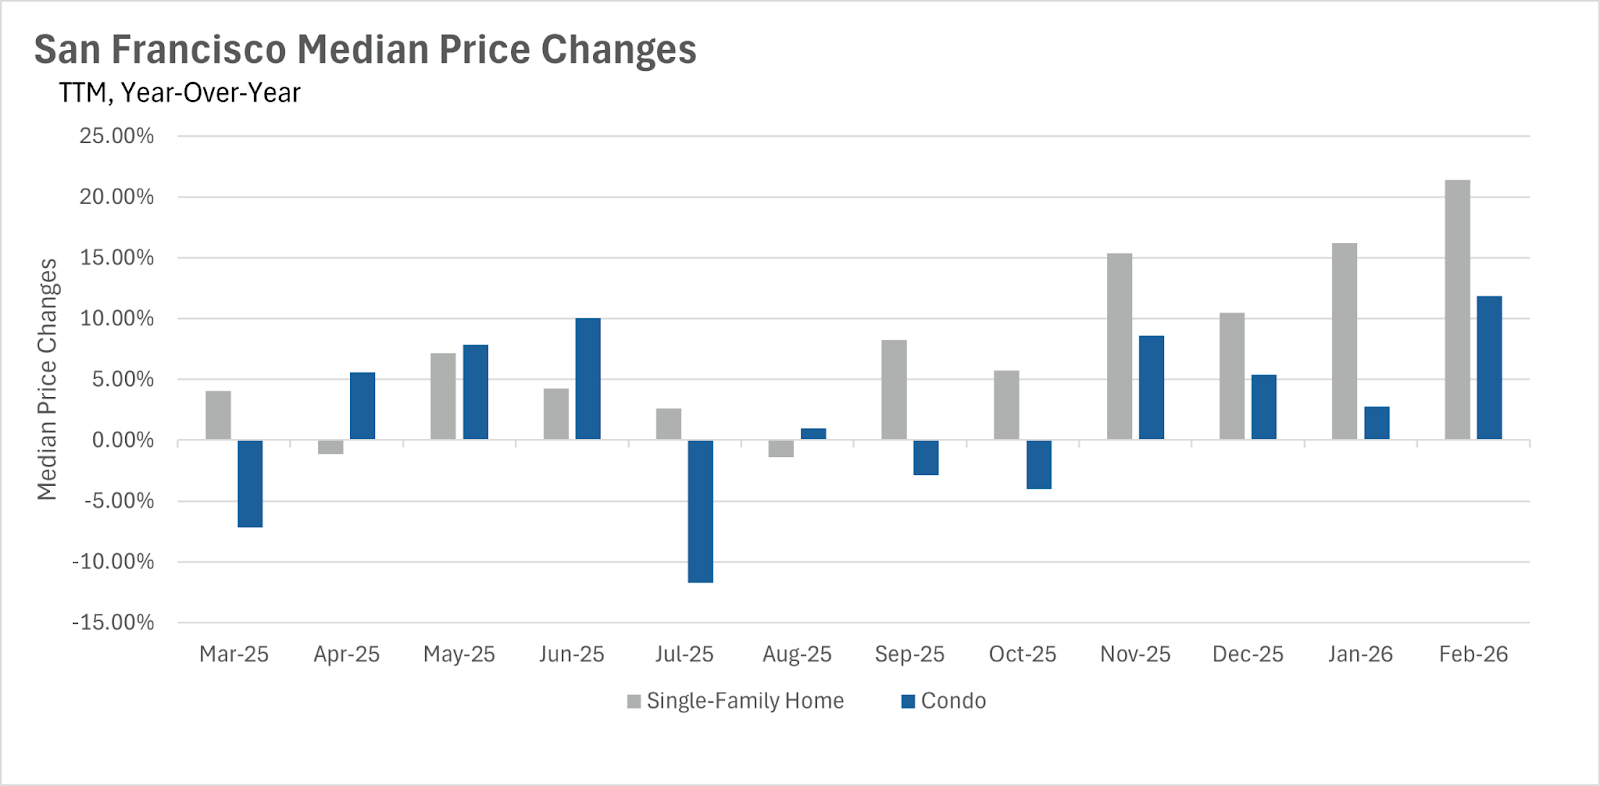
Chart of monthly San Francisco median prices for single-family homes and condos, February 2023–February 2026.

Bar chart comparing year-over-year San Francisco median price changes for single-family homes and condos, March 2025–February 2026.

Chart comparing San Francisco home and condo sale prices as a percentage of original price, February 2023–February 2026.

Work With Diana

Take a moment to check out my posts, sign up for my newsletter which highlights all kinds of cool things SF has to offer, and don’t hesitate to reach out to tell your story.

Follow Me on Instagram